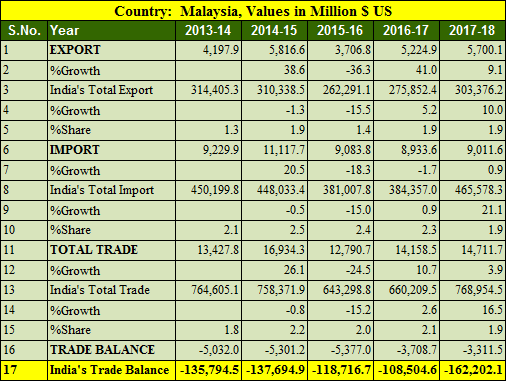
India imports mineral oils and mineral fuels from Malaysia along with animal and vegetable fats. While exporting commodities includes Aluminum articles, Meat and edible meat. India has trade deficit with Malaysia, In Financial year 2017-18 Export was 5.7 billion USD while Import recorded at 9 billions US dollars.
Key Points of India Malaysia trade balance in 5 years
- Export to Malaysia increased by 9.1% in FY 2017-18
- Import from Malaysia increased by 0.9%
- India’s export to Malaysia in 5 years is highest in 2014-15 at 5.81 billions USD.
- India’s import from Malaysia is highest in 2014-15 at 11.11 billions USD.
- Trade balance is in favor of Malaysia in tune of 3.31 billion USD.
- India’s total export was highest in 2013-14 at 314 billion USD in last 5 years.
- India’s import from Malaysia is down and it has been decreased by 2.36% since 2013-14
Also Read, India Israel trade balance analysis for 5 years : 2013- 2018
Top 25 commodity imported from Malaysia by India in 2017-18
| Country: Malaysia, Values in Million $ US | ||||
| S.No. | Commodity | 2016-17 | 2017-18 | %Growth |
| 1 | Mineral Fuels, Mineral Oils And Products Of Their Distillation; Bituminous Substances; Mineral Waxes. | 2,103.73 | 1,642.88 | -21.91 |
| 2 | Animal Or Vegetable Fats And Oils And Their Cleavage Products; Pre. Edible Fats; Animal Or Vegetable Waxes. | 1,934.93 | 1,597.30 | -17.45 |
| 3 | Electrical Machinery And Equipment And Parts Thereof; Sound Recorders And Reproducers, Television Image And Sound Recorders And Reproducers,And Parts. | 1,354.93 | 1,542.72 | 13.86 |
| 4 | Nuclear Reactors, Boilers, Machinery And Mechanical Appliances; Parts Thereof. | 526.34 | 577.57 | 9.73 |
| 5 | Copper And Articles Thereof. | 380.92 | 545.5 | 43.21 |
| 6 | Wood And Articles Of Wood; Wood Charcoal. | 424 | 430.95 | 1.64 |
| 7 | Aluminum And Articles Thereof. | 257.89 | 399.07 | 54.74 |
| 8 | Organic Chemicals | 296.5 | 378.35 | 27.61 |
| 9 | Iron And Steel | 187.48 | 283.26 | 51.09 |
| 10 | Miscellaneous Chemical Products. | 193.52 | 254.05 | 31.28 |
| 11 | Plastic And Articles Thereof. | 179.16 | 209.63 | 17 |
| 12 | Optical, Photographic Cinematographic Measuring, Checking Precision, Medical Or Surgical Inst. And Apparatus Parts And Accessories Thereof; | 113.58 | 131.56 | 15.83 |
| 13 | Furniture; Bedding, Mattresses, Mattress Supports, Cushions And Similar Stuffed Furnishing; Lamps And Lighting Fittings Not Elsewhere Specified Or Inc | 96.08 | 103.27 | 7.49 |
| 14 | Rubber And Articles Thereof. | 86.95 | 90.7 | 4.31 |
| 15 | Glass And Glassware. | 30.12 | 89.52 | 197.24 |
| 16 | Tin And Articles Thereof. | 65.61 | 88.36 | 34.66 |
| 17 | Inorganic Chemicals; Organic Or Inorganic Compounds Of Precious Metals, Of Rare-Earth Metals, Or Radi. Elem. Or Of Isotopes. | 81.81 | 62.36 | -23.77 |
| 18 | Lead And Articles Thereof. | 36.35 | 59.41 | 63.41 |
| 19 | Salt; Sulfur; Earths And Stone; Plastering Materials, Lime And Cement. | 31.76 | 56.92 | 79.22 |
| 20 | Soap, Organic Surface-Active Agents, Washing Preparations, Lubricating Preparations, Artificial Waxes, Prepared Waxes, Polishing Or Scouring Prep. | 37.13 | 54.26 | 46.13 |
| 21 | Tanning Or Dyeing Extracts; Tannin And Their Deri. Dyes, Pigments And Other Coloring Matter; Paints And Ver; Putty And Other Mastic; Inks. | 35.96 | 52.99 | 47.33 |
| 22 | Articles Of Iron Or Steel | 130.43 | 52.65 | -59.64 |
| 23 | Aircraft, Spacecraft, And Parts Thereof. | 49.65 | 46.75 | -5.83 |
| 24 | Paper And Paperboard; Articles Of Paper Pulp, Of Paper Or Of Paperboard. | 40.94 | 26.33 | -35.68 |
| 25 | Ships, Boats And Floating Structures. | 17.09 | 23.88 | 39.69 |
Top 25 commodities exported to Malaysia by India in 2017-18
| Country: Malaysia, Values in Million $ US | ||||
| S.No. | Commodity | 2016-217 | 2017-2018 | %Growth |
| 1 | Mineral Fuels, Mineral Oils And Products Of Their Distillation; Bituminous Substances; Mineral Waxes. | 915.44 | 1,624.38 | 77.44 |
| 2 | Aluminum And Articles Thereof. | 267.99 | 775.63 | 189.42 |
| 3 | Meat And Edible Meat Offal. | 354.74 | 370.59 | 4.47 |
| 4 | Organic Chemicals | 272.51 | 324.47 | 19.06 |
| 5 | Iron And Steel | 281.73 | 304.79 | 8.19 |
| 6 | Nuclear Reactors, Boilers, Machinery And Mechanical Appliances; Parts Thereof. | 393.68 | 285.37 | -27.51 |
| 7 | Copper And Articles Thereof. | 283.83 | 280.5 | -1.17 |
| 8 | Electrical Machinery And Equipment And Parts Thereof; Sound Recorders And Reproducers, Television Image And Sound Recorders And Reproducers,And Parts. | 167.98 | 173.31 | 3.17 |
| 9 | Zinc And Articles Thereof. | 142.94 | 121.13 | -15.26 |
| 10 | Edible Vegetables And Certain Roots And Tubers. | 95.35 | 106.97 | 12.19 |
| 11 | Coffee, Tea, Mate And Spices. | 114.53 | 93.67 | -18.22 |
| 12 | Cotton. | 44.68 | 89.2 | 99.67 |
| 13 | Articles Of Apparel And Clothing Accessories, Not Knitted Or Crocheted. | 64.31 | 73.68 | 14.56 |
| 14 | Miscellaneous Chemical Products. | 48.76 | 57.75 | 18.43 |
| 15 | Natural Or Cultured Pearls,Precious Or Semiprecious Stones,Pre.Metals,Clad With Pre.Metal And Articles Jewellery;Coin. | 27.9 | 56.99 | 104.28 |
| 16 | Oil Seeds And Olga. Fruits; Misc. Grains, Seeds And Fruit; Industrial Or Medicinal Plants; Straw And Fodder. | 92.01 | 56.81 | -38.26 |
| 17 | Fish And Crustaceans, Molluscs And Other Aquatic Invertebrates. | 43.45 | 56.14 | 29.21 |
| 18 | Articles Of Iron Or Steel | 58.29 | 54.31 | -6.84 |
| 19 | Pharmaceutical Products | 36.17 | 50.99 | 40.99 |
| 20 | Inorganic Chemicals; Organic Or Inorganic Compounds Of Precious Metals, Of Rare-Earth Metals, Or Radi. Elem. Or Of Isotopes. | 64.38 | 50.65 | -21.33 |
| 21 | Optical, Photographic Cinematographic Measuring, Checking Precision, Medical Or Surgical Inst. And Apparatus Parts And Accessories Thereof; | 51.63 | 47.99 | -7.05 |
| 22 | Cereals. | 27.16 | 44.13 | 62.45 |
| 23 | Vehicles Other Than Railway Or Tramway Rolling Stock, And Parts And Accessories Thereof. | 33.57 | 41.2 | 22.74 |
| 24 | Plastic And Articles Thereof. | 31.05 | 40.59 | 30.73 |
| 25 | Aircraft, Spacecraft, And Parts Thereof. | 34.27 | 37.1 | 8.25 |
Source Ministry of Commerce and Industry, India