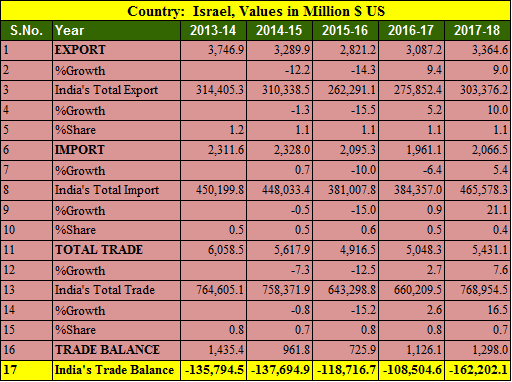
India and Israel are politically strong partners since long time.India exported goods worth 3.3 billions US dollars while imported goods worth 2.06 billions USD in financial year 2016-17. India has trade surplus with Israel in tune of 1.2 billion USD.
Key Points of India Israel trade balance in 5 years
- Export to Israel increased by 9% in FY 2017-18
- Import from Israel increased by 5.4%
- India’s export to Israel in 5 years is highest in 2013-14 at 3.74 billions USD.
- India’s import from Israel is highest in 2014-15 at 2.32 billions USD.
- Trade balance is in favor of India in tune of 1.29 billion USD.
- India’s total export was highest in 2013-14 at 314 billion USD in last 5 years.
- India’s import from Israel is down and it has been decreased by 10.6% since 2013-14
Also Read, India Indonesia trade balance analysis for 5 years : 2013- 2018
Top 25 commodity imported from Israel by India in 2017-18
| Country: Israel, Values in Million $ US | ||||
| S.No. | Commodity | 2016-17 | 2017-18 | %Growth |
| 1 | Natural Or Cultured Pearls,Precious Or Semiprecious Stones,Pre.Metals,Clad With Pre.Metal And Articles Jewellery;Coin. | 1,114.59 | 995.46 | -10.69 |
| 2 | Electrical Machinery And Equipment And Parts Thereof; Sound Recorders And Reproducers, Television Image And Sound Recorders And Reproducers,And Parts. | 209.21 | 310.03 | 48.19 |
| 3 | Fertilizers. | 179.76 | 181.92 | 1.2 |
| 4 | Optical, Photographic Cinematographic Measuring, Checking Precision, Medical Or Surgical Inst. And Apparatus Parts And Accessories Thereof; | 53.8 | 101.55 | 88.77 |
| 5 | Nuclear Reactors, Boilers, Machinery And Mechanical Appliances; Parts Thereof. | 97.9 | 98.47 | 0.59 |
| 6 | Miscellaneous Chemical Products. | 59.15 | 60.79 | 2.77 |
| 7 | Organic Chemicals | 58.91 | 45.75 | -22.34 |
| 8 | Aluminum And Articles Thereof. | 22.31 | 43.35 | 94.26 |
| 9 | Mineral Fuels, Mineral Oils And Products Of Their Distillation; Bituminous Substances; Mineral Waxes. | 1.53 | 31.88 | 1,983.28 |
| 10 | Plastic And Articles Thereof. | 24.82 | 26.21 | 5.61 |
| 11 | Aircraft, Spacecraft, And Parts Thereof. | 10.65 | 22.28 | 109.12 |
| 12 | Tools Implements, Cutlery, Spoons And Forks, Of Base Metal; Parts Thereof Of Base Metal. | 17.19 | 21.8 | 26.82 |
| 13 | Inorganic Chemicals; Organic Or Inorganic Compounds Of Precious Metals, Of Rare-Earth Metals, Or Radi. Elem. Or Of Isotopes. | 29.4 | 18.86 | -35.83 |
| 14 | Pharmaceutical Products | 8.77 | 16.64 | 89.69 |
| 15 | Cotton. | 9.83 | 15.79 | 60.65 |
| 16 | Iron And Steel | 5.97 | 11.16 | 87.04 |
| 17 | Articles Of Iron Or Steel | 3.98 | 10.05 | 152.49 |
| 18 | Tanning Or Dyeing Extracts; Tannin And Their Deri. Dyes, Pigments And Other Coloring Matter; Paints And Ver; Putty And Other Mastic; Inks. | 5.28 | 5.91 | 11.99 |
| 19 | Pulp Of Wood Or Of Other Fibrous Cellulose Material; Waste And Scrap Of Paper Or Paperboard. | 3.59 | 5.47 | 52.25 |
| 20 | Project Goods; Some Special Uses. | 3.97 | 5.3 | 33.27 |
| 21 | Salt; Sulfur; Earths And Stone; Plastering Materials, Lime And Cement. | 10.45 | 3.82 | -63.49 |
| 22 | Copper And Articles Thereof. | 2.38 | 3.64 | 52.84 |
| 23 | Preparations Of Vegetables, Fruit, Nuts Or Other Parts Of Plants. | 2.91 | 2.93 | 0.47 |
| 24 | Glass And Glassware. | 1.62 | 2.82 | 74.39 |
| 25 | Oil Seeds And Olga. Fruits; Misc. Grains, Seeds And Fruit; Industrial Or Medicinal Plants; Straw And Fodder. | 2.81 | 2.55 | -9.22 |
Top 25 commodities exported to Israel by India in 2017-18
| Country: Israel, Values in Million $ US | ||||
| S.No. | Commodity | 2016-17 | 2017-18 | %Growth |
| 1 | Mineral Fuels, Mineral Oils And Products Of Their Distillation; Bituminous Substances; Mineral Waxes. | 1,018.40 | 1,051.50 | 3.25 |
| 2 | Natural Or Cultured Pearls,Precious Or Semiprecious Stones,Pre.Metals,Clad With Pre.Metal And Articles Jewellery;Coin. | 999.4 | 1,031.34 | 3.2 |
| 3 | Organic Chemicals | 162.16 | 182.98 | 12.84 |
| 4 | Nuclear Reactors, Boilers, Machinery And Mechanical Appliances; Parts Thereof. | 35.69 | 174.48 | 388.89 |
| 5 | Electrical Machinery And Equipment And Parts Thereof; Sound Recorders And Reproducers, Television Image And Sound Recorders And Reproducers,And Parts. | 92.36 | 159.77 | 72.99 |
| 6 | Plastic And Articles Thereof. | 79.48 | 86.75 | 9.15 |
| 7 | Aircraft, Spacecraft, And Parts Thereof. | 135.39 | 70.41 | -48 |
| 8 | Vehicles Other Than Railway Or Tramway Rolling Stock, And Parts And Accessories Thereof. | 82.5 | 68.82 | -16.58 |
| 9 | Optical, Photographic Cinematographic Measuring, Checking Precision, Medical Or Surgical Inst. And Apparatus Parts And Accessories Thereof; | 38.68 | 45.82 | 18.44 |
| 10 | Articles Of Apparel And Clothing Accessories, Knitted Or Crocheted. | 43.2 | 41.03 | -5.03 |
| 11 | Cereals. | 30.14 | 40.5 | 34.37 |
| 12 | Aluminum And Articles Thereof. | 19.62 | 37.12 | 89.16 |
| 13 | Other Made Up Textile Articles; Sets; Worn Clothing And Worn Textile Articles; Rags | 31.37 | 32.32 | 3.02 |
| 14 | Miscellaneous Chemical Products. | 32.79 | 28.97 | -11.66 |
| 15 | Man-Made Staple Fibers. | 25.42 | 24.62 | -3.14 |
| 16 | Coffee, Tea, Mate And Spices. | 15.3 | 19.05 | 24.54 |
| 17 | Articles Of Apparel And Clothing Accessories, Not Knitted Or Crocheted. | 19.09 | 19 | -0.51 |
| 18 | Ceramic Products. | 11.32 | 16.73 | 47.76 |
| 19 | Paper And Paperboard; Articles Of Paper Pulp, Of Paper Or Of Paperboard. | 13.79 | 16.02 | 16.1 |
| 20 | Oil Seeds And Olga. Fruits; Misc. Grains, Seeds And Fruit; Industrial Or Medicinal Plants; Straw And Fodder. | 12.59 | 14.83 | 17.71 |
| 21 | Iron And Steel | 13.77 | 14.77 | 7.26 |
| 22 | Articles Of Iron Or Steel | 11.25 | 13.98 | 24.3 |
| 23 | Cotton. | 17.94 | 13.34 | -25.64 |
| 24 | Arms And Ammunition; Parts And Accessories Thereof. | 12.22 | 11.95 | -2.2 |
| 25 | Footwear, Gaiters And The Like; Parts Of Such Articles. | 7.99 | 10.69 | 33.84 |
Source Ministry of Commerce and Industry, India