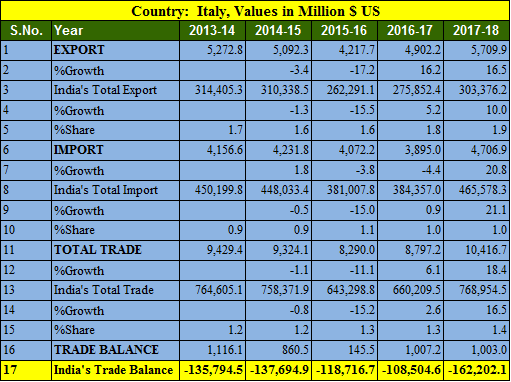
India has trade surplus with Italy worth 1 billion US dollars in financial year 2017-18. India primarily imported nuclear reactors, electrical machinery and organic chemicals while exported Iron and steel. Export to Ital was recorded 5.7 billion US dollars while Import was 4.7 billions USD.
Key Points of India Italy trade balance in 5 years
- Export to Italy increased by 16.5% in FY 2017-18
- Import from Italy increased by 20.8%
- India’s export to Italy in 5 years is highest in 2017-18 at 5.7 billions USD.
- India’s import from Italy is highest in 2017-18 at 4.7 billions USD.
- Trade balance is in favor of India in tune of 1 billion USD.
- India’s total export was highest in 2013-14 at 314 billion USD in last 5 years.
- India’s import from Italy is up and it has been increased by 13.2% since 2013-14
Also Read, India Germany trade balance analysis for 5 years : 2013- 2018
Top 25 commodity imported from Italy by India in 2017-18
| Country: Italy, Values in Million $ US | ||||
| S.No. | Commodity | 2016-2017 | 2017-2018 | %Growth |
| 1 | Nuclear Reactors, Boilers, Machinery And Mechanical Appliances; Parts Thereof. | 1,467.6 | 1,692.7 | 15.3 |
| 2 | Electrical Machinery And Equipment And Parts Thereof; Sound Recorders And Reproducers, Television Image And Sound Recorders And Reproducers,And Parts. | 225.1 | 280.9 | 24.8 |
| 3 | Organic Chemicals | 235.1 | 269.7 | 14.8 |
| 4 | Plastic And Articles Thereof. | 155.0 | 200.4 | 29.3 |
| 5 | Optical, Photographic Cinematographic Measuring, Checking Precision, Medical Or Surgical Inst. And Apparatus Parts And Accessories Thereof; | 127.2 | 160.9 | 26.5 |
| 6 | Articles Of Iron Or Steel | 152.5 | 153.0 | 0.3 |
| 7 | Vehicles Other Than Railway Or Tramway Rolling Stock, And Parts And Accessories Thereof. | 84.5 | 145.5 | 72.3 |
| 8 | Project Goods; Some Special Uses. | 70.0 | 139.5 | 99.3 |
| 9 | Mineral Fuels, Mineral Oils And Products Of Their Distillation; Bituminous Substances; Mineral Waxes. | 6.1 | 139.2 | 2,201.7 |
| 10 | Salt; Sulfur; Earths And Stone; Plastering Materials, Lime And Cement. | 115.9 | 108.7 | -6.2 |
| 11 | Paper And Paperboard; Articles Of Paper Pulp, Of Paper Or Of Paperboard. | 113.6 | 100.9 | -11.2 |
| 12 | Miscellaneous Chemical Products. | 94.3 | 100.4 | 6.4 |
| 13 | Pharmaceutical Products | 71.7 | 87.5 | 22.0 |
| 14 | Rubber And Articles Thereof. | 85.7 | 83.2 | -2.9 |
| 15 | Furniture; Bedding, Mattresses, Mattress Supports, Cushions And Similar Stuffed Furnishing; Lamps And Lighting Fittings Not Elsewhere Specified Or Inc | 68.0 | 81.1 | 19.2 |
| 16 | Raw Hides And Skins (Other Than Fur skins) And Leather | 79.7 | 77.3 | -3.0 |
| 17 | Iron And Steel | 69.2 | 71.1 | 2.7 |
| 18 | Aircraft, Spacecraft, And Parts Thereof. | 57.5 | 70.7 | 23.0 |
| 19 | Natural Or Cultured Pearls,Precious Or Semiprecious Stones,Pre.Metals,Clad With Pre.Metal And Articles Thereof Jewellery;Coin. | 42.3 | 64.8 | 53.4 |
| 20 | Tanning Or Dyeing Extracts; Tannin’s And Their Deri. Dyes, Pigments And Other Coloring Matter; Paints And Ver; Putty And Other Mastic; Inks. | 54.7 | 61.0 | 11.5 |
| 21 | Tools Implements, Cutlery, Spoons And Forks, Of Base Metal; Parts Thereof Of Base Metal. | 22.7 | 55.1 | 143.1 |
| 22 | Soap, Organic Surface-Active Agents, Washing Preparations, Lubricating Preparations, Artificial Waxes, Prepared Waxes, Polishing Or Scouring Prep. | 23.9 | 35.5 | 49.0 |
| 23 | Aluminum And Articles Thereof. | 27.4 | 33.4 | 22.0 |
| 24 | Inorganic Chemicals; Organic Or Inorganic Compounds Of Precious Metals, Of Rare-Earth Metals | 23.4 | 30.1 | 28.9 |
| 25 | Articles Of Stone, Plaster, Cement, Asbestos, Mica Or Similar Materials. | 33.5 | 28.6 | -14.6 |
Top 25 commodities exported to Italy by India in 2017-18
| Country: Italy, Values in Million $ US | ||||
| S.No. | Commodity | 2016-2017 | 2017-2018 | %Growth |
| 1 | Iron And Steel | 764.5 | 1033.7 | 35.2 |
| 2 | Vehicles Other Than Railway Or Tramway Rolling Stock, And Parts And Accessories Thereof. | 515.6 | 469.6 | -8.9 |
| 3 | Nuclear Reactors, Boilers, Machinery And Mechanical Appliances; Parts Thereof. | 342.5 | 453.8 | 32.5 |
| 4 | Organic Chemicals | 313.9 | 355.5 | 13.3 |
| 5 | Plastic And Articles Thereof. | 226.4 | 318.1 | 40.5 |
| 6 | Articles Of Apparel And Clothing Accessories, Knitted Or Crocheted. | 209.5 | 231.7 | 10.6 |
| 7 | Aluminum And Articles Thereof. | 161.7 | 197.1 | 21.9 |
| 8 | Coffee, Tea, Mate And Spices. | 189.1 | 186.2 | -1.6 |
| 9 | Articles Of Iron Or Steel | 168.1 | 174.4 | 3.7 |
| 10 | Articles Of Apparel And Clothing Accessories, Not Knitted Or Crocheted. | 161.6 | 164.2 | 1.6 |
| 11 | Fish And Crustaceans, Molluscs And Other Aquatic Invertebrates. | 156.0 | 160.6 | 2.9 |
| 12 | Mineral Fuels, Mineral Oils And Products Of Their Distillation; Bituminous Substances; Mineral Waxes. | 34.1 | 153.4 | 349.9 |
| 13 | Articles Of Leather,Saddlery And Harness;Travel Goods, Handbags And Similar Cont.Articles Of Animal Gut(Other Than Silk-Worm)Gut. | 133.6 | 151.4 | 13.3 |
| 14 | Footwear, Gaiters And The Like; Parts Of Such Articles. | 139.7 | 136.9 | -2.0 |
| 15 | Other Made Up Textile Articles; Sets; Worn Clothing And Worn Textile Articles; Rags | 118.0 | 129.8 | 10.0 |
| 16 | Natural Or Cultured Pearls,Precious Or Semiprecious Stones,Pre.Metals,Clad With Pre.Metal And Articles Thereof;Imit.Jewelry;Coin. | 109.7 | 118.3 | 7.8 |
| 17 | Raw Hides And Skins (Other Than Fur skins) And Leather | 111.3 | 117.6 | 5.6 |
| 18 | Tanning Or Dyeing Extracts; Tannin’s And Their Deri. Dyes, Pigments And Other Coloring Matter; Paints And Ver; Putty And Other Mastic; Inks. | 99.9 | 115.8 | 15.9 |
| 19 | Electrical Machinery And Equipment And Parts Thereof; Sound Recorders And Reproducers, Television Image And Sound Recorders And Reproducers,And Parts. | 102.1 | 108.2 | 5.9 |
| 20 | Cotton. | 95.3 | 107.2 | 12.5 |
| 21 | Rubber And Articles Thereof. | 78.3 | 93.1 | 18.9 |
| 22 | Special Woven Fabrics; Tufted Textile Fabrics; Lace; Tapestries; Trimmings; Embroidery. | 70.8 | 76.3 | 7.8 |
| 23 | Man-Made Staple Fibres. | 49.2 | 55.1 | 12.0 |
| 24 | Optical, Photographic Cinematographic Measuring, Checking Precision, Medical Or Surgical Inst. And Apparatus Parts And Accessories Thereof; | 30.3 | 47.8 | 57.7 |
| 25 | Cereals. | 29.2 | 45.5 | 56.0 |
Source Ministry of Commerce and Industry, India