India is hub of polished precious metals and stones. India imported Natural pearls and precious stones worth 8.7 billions US dollars and at the same time exported 13.1 billion USD to Hong Kong in 2017-18. India Hong Kong trade balance is in favor of India. India has trade surplus of 4 billions USD dollars.
Key Points of India Hong Kong trade balance in 5 years
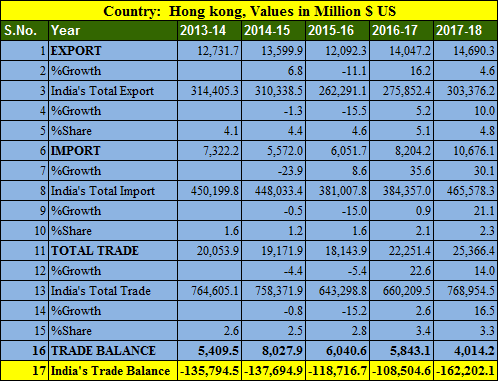
- Export to Hong Kong increased by 4.6% in FY 2017-18
- Import from Hong Kong increased by 30.1%
- India’s export to Hong Kong in 5 years is highest in 2017-18 at 14.69 billions USD.
- India’s import from Hong Kong is highest in 2017-18 at 10.67 billions USD.
- Trade balance is in favor of India in tune of 4 billion USD.
- India’s total export was highest in 2013-14 at 314 billion USD in last 5 years.
- India’s import from Hong Kong is up and it has been increased by 45% since 2013-14
Also Read, India Italy trade balance analysis for 5 years : 2013- 2018
Top 25 commodity imported from Hong Kong by India in 2017-18
| Country: Hong Kong, Values in Million $ US | ||||
| S.No. | Commodity | 2016-2017 | 2017-2018 | %Growth |
| 1 | Natural Or Cultured Pearls,Precious Or Semiprecious Stones,Pre.Metals,Clad With Pre.Metal And Article, Jewellery;Coin. | 6,279.9 | 8,708.9 | 38.7 |
| 2 | Electrical Machinery And Equipment And Parts Thereof; Sound Recorders And Reproducers, Television Image And Sound Recorders And Reproducers,And Parts. | 1,126.6 | 1,208.4 | 7.3 |
| 3 | Nuclear Reactors, Boilers, Machinery And Mechanical Appliances; Parts Thereof. | 119.4 | 137.2 | 14.9 |
| 4 | Iron And Steel | 38.3 | 71.5 | 86.6 |
| 5 | Clocks And Watches And Parts Thereof. | 51.8 | 65.0 | 25.5 |
| 6 | Optical, Photographic Cinematographic Measuring, Checking Precision, Medical Or Surgical Inst. And Apparatus Parts And Accessories Thereof; | 61.8 | 57.5 | -7.1 |
| 7 | Special Woven Fabrics; Tufted Textile Fabrics; Lace; Tapestries; Trimmings; Embroidery. | 58.5 | 55.4 | -5.2 |
| 8 | Plastic And Articles Thereof. | 52.8 | 50.3 | -4.7 |
| 9 | Miscellaneous Manufactured Articles. | 33.4 | 31.3 | -6.5 |
| 10 | Paper And Paperboard; Articles Of Paper Pulp, Of Paper Or Of Paperboard. | 26.9 | 25.1 | -7.0 |
| 11 | Ships, Boats And Floating Structures. | 31.5 | 24.9 | -21.0 |
| 12 | Aluminium And Articles Thereof. | 9.1 | 21.0 | 131.5 |
| 13 | Knitted Or Crocheted Fabrics. | 28.1 | 19.7 | -30.1 |
| 14 | Miscellaneous Articles Of Base Metal. | 18.1 | 18.4 | 1.5 |
| 15 | Footwear, Gaiters And The Like; Parts Of Such Articles. | 29.4 | 16.6 | -43.5 |
| 16 | Furniture; Bedding, Mattresses, Mattress Supports, Cushions And Similar Stuffed Furnishing; Lamps And Lighting Fittings Not Elsewhere Specified Or Inc | 13.5 | 11.7 | -13.1 |
| 17 | Raw Hides And Skins (Other Than Fur skins) And Leather | 21.7 | 11.7 | -46.3 |
| 18 | Articles Of Apparel And Clothing Accessories, Knitted Or Crocheted. | 13.3 | 10.9 | -17.8 |
| 19 | Organic Chemicals | 11.7 | 9.8 | -16.6 |
| 20 | Articles Of Iron Or Steel | 10.4 | 9.7 | -6.4 |
| 21 | Cotton. | 9.4 | 8.9 | -5.4 |
| 22 | Rubber And Articles Thereof. | 12.7 | 7.8 | -38.7 |
| 23 | Printed Books, Newspapers, Pictures And Other Products Of The Printing Industry; Manuscripts, Typescripts And Plans. | 5.3 | 7.7 | 46.4 |
| 24 | Vehicles Other Than Railway Or Tramway Rolling Stock, And Parts And Accessories Thereof. | 5.8 | 6.7 | 15.4 |
| 25 | Man-Made Filaments. | 6.8 | 6.5 | -4.7 |
Top 25 commodities exported to Hong Kong by India in 2017-18
| Country: Hong Kong, Values in Million $ US | ||||
| S.No. | Commodity | 2016-2017 | 2017-2018 | %Growth |
| 1 | Natural Or Cultured Pearls,Precious Or Semiprecious Stones,Pre.Metals,Clad With Pre.Metal And Articles Jewelry, Coin. | 12,835.8 | 13,124.1 | 2.3 |
| 2 | Mineral Fuels, Mineral Oils And Products Of Their Distillation; Bituminous Substances; Mineral Waxes. | 141.1 | 267.5 | 89.6 |
| 3 | Electrical Machinery And Equipment And Parts Thereof; Sound Recorders And Reproducers, Television Image And Sound Recorders And Reproducers,And Parts. | 197.6 | 242.1 | 22.5 |
| 4 | Raw Hides And Skins (Other Than Fur skins) And Leather | 231.4 | 210.1 | -9.2 |
| 5 | Iron And Steel | 7.4 | 117.1 | 1,479.6 |
| 6 | Nuclear Reactors, Boilers, Machinery And Mechanical Appliances; Parts Thereof. | 34.8 | 114.3 | 228.3 |
| 7 | Fish And Crustaceans, Molluscs And Other Aquatic Invertebrates. | 78.8 | 83.7 | 6.2 |
| 8 | Cotton. | 78.9 | 46.8 | -40.7 |
| 9 | Organic Chemicals | 49.7 | 46.5 | -6.5 |
| 10 | Essential Oils And Resinous; Perfumery, Cosmetic Or Toilet Preparations. | 13.0 | 43.1 | 232.1 |
| 11 | Articles Of Apparel And Clothing Accessories, Not Knitted Or Crocheted. | 39.7 | 38.7 | -2.6 |
| 12 | Meat And Edible Meat Offal. | 5.0 | 36.5 | 633.7 |
| 13 | Articles Of Apparel And Clothing Accessories, Knitted Or Crocheted. | 19.0 | 31.7 | 67.1 |
| 14 | Optical, Photographic Cinematographic Measuring, Checking Precision, Medical Or Surgical Inst. And Apparatus Parts And Accessories Thereof; | 26.8 | 30.0 | 12.0 |
| 15 | Articles Of Leather,Saddlery And Harness;Travel Goods, Handbags And Similar Cont.Articles Of Animal Gut(Other Than Silk-Worm)Gut. | 21.3 | 26.9 | 26.2 |
| 16 | Pharmaceutical Products | 18.9 | 21.3 | 12.5 |
| 17 | Salt; Sulfur; Earths And Stone; Plastering Materials, Lime And Cement. | 17.0 | 16.6 | -2.5 |
| 18 | Plastic And Articles Thereof. | 16.9 | 13.5 | -19.6 |
| 19 | Clocks And Watches And Parts Thereof. | 19.2 | 13.4 | -30.5 |
| 20 | Footwear, Gaiters And The Like; Parts Of Such Articles. | 15.1 | 12.9 | -14.4 |
| 21 | Wood And Articles Of Wood; Wood Charcoal. | 12.0 | 12.2 | 1.7 |
| 22 | Edible Fruit And Nuts; Peel Or Citrus Fruit Or Melons. | 10.9 | 12.2 | 11.7 |
| 23 | Oil Seeds And Olga. Fruits; Misc. Grains, Seeds And Fruit; Industrial Or Medicinal Plants; Straw And Fodder. | 23.3 | 11.0 | -52.6 |
| 24 | Tanning Or Dyeing Extracts; Tannin’s And Their Deri. Dyes, Pigments And Other Coloring Matter; Paints And Ver; Putty And Other Mastic; Inks. | 11.2 | 9.7 | -13.4 |
| 25 | Prepared Feathers And Down And Articles Made Of Feathers Or Of Down; Artificial Flowers; Articles Of Human Hair. | 10.4 | 7.3 | -30.1 |
Source Ministry of Commerce and Industry, India