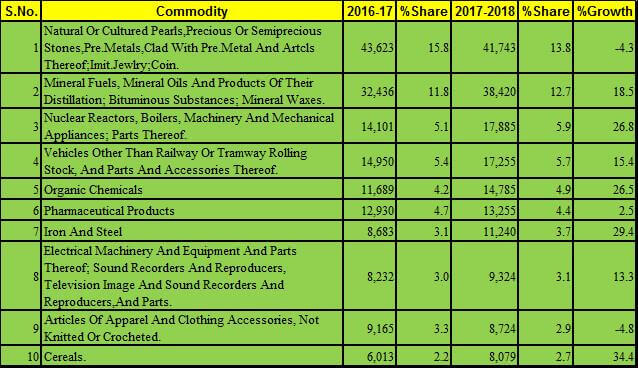
Top 10 commodities exported by India in 2017-18
Top 10 commodities exported by India is lead by Natural Or Cultured Pearls,Precious Or Semiprecious Stones, pre metals,clad with pre metal And Articles, Jewellery and Coin.
India exported goods worth 303.37 billion US dollar in financial year 2017-18. Export registered a 9.98% growth over previous finance year 2016-17.
India’s export in FY 2016-17 was pegged at 275.85 billion US dollar. However this growth was nullified as import was up by 21.1% at 465.57 billion US dollar. In Financial year 2016-17 India imported goods worth 384.35 US dollar.

India exported 41.7 billion USD in this category, however it registered a de-growth over previous year when it was 43.6 billion US dollar. It contributed 13.8% of total export bill.
Second slot is occupies by Mineral Fuels, Mineral oils & products of their distillation; Bituminous substances and Mineral Waxes at 38.4 billion US dollar. It registered a whopping 18.5% growth over preceding year and contributed 12.7% in total export bill.
also read, India’s Export increases 9.98% in Year 2017-18
Third slot is occupied by Nuclear reactors, boilers, machinery, mechanical appliance & parts at 17.8 billion US dollar. This export category registered 26.8% growth over FY 2016-17 when it was 14.1 billion USD. It also moved to third place from 4th place in previous year.
Fourth slot is occupied by Vehicles other than Railway or tramway rolling stock, parts and accessories at 17.25 billion US dollar. In Financial year export under this category was 14.95 US dollar, it increased to 15.4% comparing to consecutive year.
Fifth slot is fixed by organic chemicals at a export value of 14.78 billion US dollar. Sixth position is hold by pharmaceutical products at 13.25 billion USD, seventh by iron and steel at 11.24 billion USD, eight, ninth and tenth slots are occupied by Electrical machinery, apparel & clothing and cereals respectively.
Top 10 commodities exported by India contribute 59.6% of export value worth 180.71 billion USD. Complete list of top 10 commodities are listed in tabular form.
| S.No. | Commodity | 2016-17 | %Share | 2017-2018 | %Share | %Growth |
| 1 | Natural Or Cultured Pearls,Precious Or Semiprecious Stones,Pre.Metals,Clad With Pre.Metal And Artcls Thereof;Imit.Jewlry;Coin. | 43,623 | 15.8 | 41,743 | 13.8 | -4.3 |
| 2 | Mineral Fuels, Mineral Oils And Products Of Their Distillation; Bituminous Substances; Mineral Waxes. | 32,436 | 11.8 | 38,420 | 12.7 | 18.5 |
| 3 | Nuclear Reactors, Boilers, Machinery And Mechanical Appliances; Parts Thereof. | 14,101 | 5.1 | 17,885 | 5.9 | 26.8 |
| 4 | Vehicles Other Than Railway Or Tramway Rolling Stock, And Parts And Accessories Thereof. | 14,950 | 5.4 | 17,255 | 5.7 | 15.4 |
| 5 | Organic Chemicals | 11,689 | 4.2 | 14,785 | 4.9 | 26.5 |
| 6 | Pharmaceutical Products | 12,930 | 4.7 | 13,255 | 4.4 | 2.5 |
| 7 | Iron And Steel | 8,683 | 3.1 | 11,240 | 3.7 | 29.4 |
| 8 | Electrical Machinery And Equipment And Parts Thereof; Sound Recorders And Reproducers, Television Image And Sound Recorders And Reproducers,And Parts. | 8,232 | 3.0 | 9,324 | 3.1 | 13.3 |
| 9 | Articles Of Apparel And Clothing Accessories, Not Knitted Or Crocheted. | 9,165 | 3.3 | 8,724 | 2.9 | -4.8 |
| 10 | Cereals. | 6,013 | 2.2 | 8,079 | 2.7 | 34.4 |
source Ministry of commerce & Industry, India
![]()