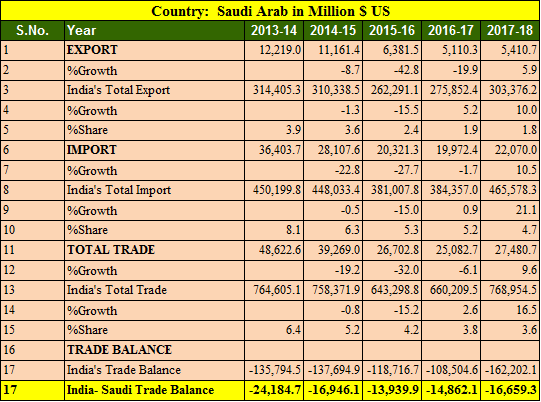
Saudi Arab is first preference of India for importing mineral oil an fuels. So is the trade deficit, India has 16.65 billion US dollar trade deficit with Saudi Arabia. India exported goods worth 5.4 billions USD while import was whopping 22 billions US dollars.
Key Points of India Saudi Arab trade balance in 5 years
- Export to Saudi Arab increased by 5.9% in FY 2017-18
- Import from Saudi Arab increased by 10.5%
- India’s export to Saudi Arab in 5 years is highest in 2013-14 at 12.21 billions USD.
- India’s import from Saudi Arab is highest in 2013-14 at 36.40 billions USD.
- Trade balance is in favor of Saudi Arab in tune of 16.65 billions USD.
- India’s total export was highest in 2013-14 at 314 billion USD in last 5 years.
- India’s import from Saudi Arab is falling and it has been decreased 40% since 2013-14 due to crude oil pricing
Also Read, India UAE trade analysis for 5 years
Top 25 commodity imported from Saudi Arab by India in 2017-18
| Country: Saudi Arab, value in Million $ US | ||||
| S.No. | Commodity | 2016-17 | 2017-18 | %Growth |
| 1 | Mineral Fuels, Mineral Oils And Products Of Their Distillation; Bituminous Substances; Mineral Waxes. | 15,583.08 | 17,816.06 | 14.33 |
| 2 | Organic Chemicals | 1,697.55 | 1,538.00 | -9.4 |
| 3 | Plastic And Articles Thereof. | 880.21 | 1,000.61 | 13.68 |
| 4 | Fertilizers. | 401.65 | 509.4 | 26.83 |
| 5 | Aluminum And Articles Thereof. | 202.86 | 295.71 | 45.77 |
| 6 | Inorganic Chemicals; Organic Or Inorganic Compounds Of Precious Metals, Of Rare-Earth Metals | 127.94 | 188.26 | 47.14 |
| 7 | Copper And Articles Thereof. | 121.24 | 134.12 | 10.62 |
| 8 | Miscellaneous Chemical Products. | 115.26 | 100.9 | -12.45 |
| 9 | Ores, Slag And Ash. | 78.97 | 98.75 | 25.06 |
| 10 | Pulp Of Wood Or Of Other Fibrous Cellulose Material; Waste And Scrap Of Paper Or Paperboard. | 44.75 | 51.79 | 15.74 |
| 11 | Aircraft, Spacecraft, And Parts Thereof. | 89.63 | 48.22 | -46.2 |
| 12 | Iron And Steel | 35.7 | 40.73 | 14.11 |
| 13 | Raw Hides And Skins (Other Than Fur skins) And Leather | 39.75 | 39.71 | -0.1 |
| 14 | Salt; Sulfur; Earths And Stone; Plastering Materials, Lime And Cement. | 56.52 | 36.82 | -34.86 |
| 15 | Tanning Or Dyeing Extracts; Tannins Dyes, Pigments And Other Coloring Matter; Paints ; Putty And Other Mastic; Inks. | 18.62 | 33.58 | 80.33 |
| 16 | Rubber And Articles Thereof. | 2.68 | 19.54 | 630.23 |
| 17 | Zinc And Articles Thereof. | 11.16 | 15.07 | 34.98 |
| 18 | Articles Of Stone, Plaster, Cement, Asbestos, Mica Or Similar Materials. | 2.24 | 11.98 | 434.1 |
| 19 | Nuclear Reactors, Boilers, Machinery And Mechanical Appliances; Parts Thereof. | 3.57 | 11.79 | 230.63 |
| 20 | Wadding, Felt And Non-wovens; Spacial Yarns; Twine, Cordage, Ropes And Cables And Articles Thereof. | 6.78 | 10.58 | 56.09 |
| 21 | Glass And Glassware. | 12.35 | 10.15 | -17.79 |
| 22 | Lead And Articles Thereof. | 13.33 | 9.83 | -26.3 |
| 23 | Articles Of Iron Or Steel | 3.52 | 8.55 | 142.89 |
| 24 | Nickel And Articles Thereof. | 3.17 | 6.88 | 116.72 |
| 25 | Electrical Machinery And Equipment And Parts Thereof; Sound Recorders And Reproducers, Television Image And Sound Recorders And Reproducers,And Parts. | 0.23 | 5.67 | 2,345.34 |
Top 25 commodities exported to Saudi Arab by India in 2017-18
| Country: Saudi Arab, Value in Million $ US | ||||
| S.No. | Commodity | 2016-17 | 2017-18 | %Growth |
| 1 | Cereals. | 741.32 | 908.03 | 22.49 |
| 2 | Organic Chemicals | 419.17 | 602.33 | 43.69 |
| 3 | Mineral Fuels, Mineral Oils And Products Of Their Distillation; Bituminous Substances; Mineral Waxes. | 531.13 | 458.94 | -13.59 |
| 4 | Nuclear Reactors, Boilers, Machinery And Mechanical Appliances; Parts Thereof. | 283.14 | 330.06 | 16.57 |
| 5 | Vehicles Other Than Railway Or Tramway Rolling Stock, And Parts And Accessories Thereof. | 271.71 | 300.21 | 10.49 |
| 6 | Articles Of Iron Or Steel | 342.19 | 262.68 | -23.24 |
| 7 | Ceramic Products. | 214.61 | 217.13 | 1.18 |
| 8 | Articles Of Apparel And Clothing Accessories, Knitted Or Crocheted. | 202.52 | 206.74 | 2.08 |
| 9 | Articles Of Apparel And Clothing Accessories, Not Knitted Or Crocheted. | 256.7 | 206.14 | -19.7 |
| 10 | Edible Fruit And Nuts; Peel Or Citrus Fruit Or Melons. | 157.13 | 164.61 | 4.76 |
| 11 | Iron And Steel | 83.28 | 155.64 | 86.9 |
| 12 | Electrical Machinery And Equipment And Parts Thereof; Sound Recorders And Reproducers, Television Image And Sound Recorders And Reproducers,And Parts. | 151.4 | 150.09 | -0.87 |
| 13 | Meat And Edible Meat Offal. | 178.21 | 145.3 | -18.46 |
| 14 | Coffee, Tea, Mate And Spices. | 107.47 | 123.85 | 15.25 |
| 15 | Salt; Sulfur; Earths And Stone; Plastering Materials, Lime And Cement. | 88.94 | 85.11 | -4.3 |
| 16 | Plastic And Articles Thereof. | 74.47 | 77.25 | 3.73 |
| 17 | Essential Oils And Resinous; Perfumery, Cosmetic Or Toilet Preparations. | 57.43 | 64.3 | 11.96 |
| 18 | Miscellaneous Chemical Products. | 37.69 | 48.8 | 29.46 |
| 19 | Paper And Paperboard; Articles Of Paper Pulp, Of Paper Or Of Paperboard. | 26.57 | 42.11 | 58.48 |
| 20 | Edible Vegetables And Certain Roots And Tubers. | 47.24 | 40.76 | -13.72 |
| 21 | Rubber And Articles Thereof. | 32.91 | 37.23 | 13.15 |
| 22 | Residues And Waste From The Food Industries; Prepared Animal Fodder. | 3.9 | 37.05 | 849.98 |
| 23 | Sugars And Sugar Confectionery. | 42.93 | 34.15 | -20.46 |
| 24 | Man-Made Filaments. | 16.2 | 31.49 | 94.35 |
| 25 | Copper And Articles Thereof. | 83.13 | 30.6 | -63.19 |
Source Ministry of Commerce and Industry, India