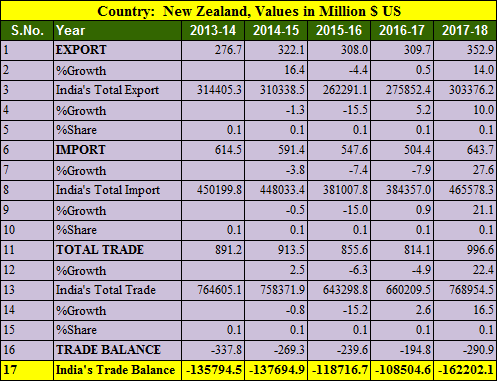
New Zealand is one of the favorite education destination for Indians. India and New Zealand are not natural trading allies and it happens occasionally. India’s export to New Zealand was 352 millions US dollars while import recorded at 643 millions resulting trade deficit of 290 millions USD. However biggest export to New Zealand is talent by India.
Key Points of India New Zealand trade balance in 5 years
- Export to New Zealand increased by 14% in FY 2017-18
- Import from New Zealand decreased by 27.6%
- India’s export to New Zealand in 5 years is highest in 2017-18 at 352.9 millions USD.
- India’s import from New Zealand is highest in 2017-18 at 643.7 millions USD.
- Trade balance is in favor of New Zealand in tune of 290 millions USD.
- India’s total export was highest in 2013-14 at 314 billion USD in last 5 years.
- India’s import from New Zealand is up and it has been increased by 4.75% since 2013-14
Also Read, India Netherlands trade balance analysis for 5 years : 2013- 2018
Top 25 commodity imported from New Zealand by India in 2017-18
| Country: New Zealand, Values in Million $ US | ||||
| S.No. | Commodity | 2016-17 | 2017-18 | %Growth |
| 1 | Wood And Articles Of Wood; Wood Charcoal. | 208.68 | 271.49 | 30.1 |
| 2 | Mineral Fuels, Mineral Oils And Products Of Their Distillation; Bituminous Substances; Mineral Waxes. | 65.84 | 116.75 | 77.33 |
| 3 | Pulp Of Wood Or Of Other Fibrous Cellulose Material; Waste And Scrap Of Paper Or Paperboard. | 33.41 | 43.53 | 30.29 |
| 4 | Aluminum And Articles Thereof. | 19.12 | 30.36 | 58.79 |
| 5 | Paper And Paperboard; Articles Of Paper Pulp, Of Paper Or Of Paperboard. | 30.97 | 29.75 | -3.95 |
| 6 | Iron And Steel | 20.58 | 29.74 | 44.55 |
| 7 | Wool, Fine Or Coarse Animal Hair, Horsehair Yarn And Woven Fabric. | 29.05 | 26.76 | -7.88 |
| 8 | Edible Fruit And Nuts; Peel Or Citrus Fruit Or Melons. | 29.45 | 22.28 | -24.35 |
| 9 | Nuclear Reactors, Boilers, Machinery And Mechanical Appliances; Parts Thereof. | 5.96 | 12.91 | 116.55 |
| 10 | Raw Hides And Skins (Other Than Fur skins) And Leather | 12.38 | 7.96 | -35.73 |
| 11 | Albuminous Substances; Modified Starches; Glues; Enzymes. | 3.38 | 7.78 | 130.24 |
| 12 | Optical, Photographic Cinematographic Measuring, Checking Precision, Medical Or Surgical Inst. And Apparatus Parts And Accessories Thereof; | 6.8 | 7.14 | 5.02 |
| 13 | Sugars And Sugar Confectionery. | 6.15 | 6.09 | -0.96 |
| 14 | Organic Chemicals | 1.43 | 5.36 | 274.46 |
| 15 | Electrical Machinery And Equipment And Parts Thereof; Sound Recorders And Reproducers, Television Image And Sound Recorders And Reproducers,And Parts. | 6.3 | 4.69 | -25.56 |
| 16 | Oil Seeds And Olga. Fruits; Misc. Grains, Seeds And Fruit; Industrial Or Medicinal Plants; Straw And Fodder. | 4.2 | 3.01 | -28.41 |
| 17 | Dairy Produce; Birds’ Eggs; Natural Honey; Edible Prod. Of Animal Origin, Not Elsewhere Spec. Or Included. | 4.82 | 2.19 | -54.46 |
| 18 | Zinc And Articles Thereof. | 1.03 | 1.33 | 29.61 |
| 19 | Plastic And Articles Thereof. | 1.3 | 1.26 | -3.2 |
| 20 | Pharmaceutical Products | 1.56 | 1.22 | -22.31 |
| 21 | Articles Of Iron Or Steel | 0.54 | 1.14 | 111.89 |
| 22 | Copper And Articles Thereof. | 0.55 | 1.13 | 106.67 |
| 23 | Meat And Edible Meat Offal. | 0.78 | 1.08 | 37.36 |
| 24 | Rubber And Articles Thereof. | 0.74 | 0.95 | 29.35 |
| 25 | Railway Or Tramway Locomotives, Rolling-Stock And Parts Thereof; Railway Or Tramway Track Fixtures And Fittings And Parts Thereof; Mechanical | 0.9 | 0.89 | -1.15 |
Top 25 commodities exported to New Zealand by India in 2017-18
| Country: New Zealand, Values in Million $ US | ||||
| S.No. | Commodity | 2016-17 | 2017-18 | %Growth |
| 1 | Pharmaceutical Products | 37.45 | 37.97 | 1.39 |
| 2 | Other Made Up Textile Articles; Sets; Worn Clothing And Worn Textile Articles; Rags | 19.7 | 26.13 | 32.64 |
| 3 | Nuclear Reactors, Boilers, Machinery And Mechanical Appliances; Parts Thereof. | 7.99 | 23.32 | 191.75 |
| 4 | Vehicles Other Than Railway Or Tramway Rolling Stock, And Parts And Accessories Thereof. | 16.62 | 21.47 | 29.21 |
| 5 | Natural Or Cultured Pearls,Precious Or Semiprecious Stones,Pre.Metals,Clad With Pre.Metal And Articles Jewellery;Coin. | 17.59 | 21.24 | 20.79 |
| 6 | Articles Of Apparel And Clothing Accessories, Not Knitted Or Crocheted. | 13.4 | 14.01 | 4.54 |
| 7 | Miscellaneous Chemical Products. | 5.57 | 9.94 | 78.4 |
| 8 | Iron And Steel | 4.01 | 9.22 | 130.18 |
| 9 | Organic Chemicals | 10.89 | 9.06 | -16.86 |
| 10 | Articles Of Apparel And Clothing Accessories, Knitted Or Crocheted. | 7.2 | 8.97 | 24.5 |
| 11 | Plastic And Articles Thereof. | 11.15 | 8.92 | -20.03 |
| 12 | Rubber And Articles Thereof. | 7.48 | 8.79 | 17.54 |
| 13 | Articles Of Iron Or Steel | 7.13 | 8.56 | 20.18 |
| 14 | Articles Of Leather,Saddlery And Harness;Travel Goods, Handbags And Similar Cont.Articles Of Animal Gut(Other Than Silk-Worm)Gut. | 6.9 | 7.88 | 14.14 |
| 15 | Electrical Machinery And Equipment And Parts Thereof; Sound Recorders And Reproducers, Television Image And Sound Recorders And Reproducers,And Parts. | 6.25 | 7.83 | 25.31 |
| 16 | Carpets And Other Textile Floor Coverings. | 5.78 | 7.35 | 27.3 |
| 17 | Coffee, Tea, Mate And Spices. | 6.37 | 6.96 | 9.32 |
| 18 | Cereals. | 6.44 | 6.57 | 1.95 |
| 19 | Zinc And Articles Thereof. | 1.22 | 6.54 | 436.09 |
| 20 | Preparations Of Vegetables, Fruit, Nuts Or Other Parts Of Plants. | 5.39 | 5.94 | 10.34 |
| 21 | Essential Oils And Resinous; Perfumery, Cosmetic Or Toilet Preparations. | 4.76 | 5.8 | 21.67 |
| 22 | Furniture; Bedding, Mattresses, Mattress Supports, Cushions And Similar Stuffed Furnishing; Lamps And Lighting Fittings Not Elsewhere Specified Or Inc | 4.85 | 5.16 | 6.42 |
| 23 | Tanning Or Dyeing Extracts; Tannin And Their Deri. Dyes, Pigments And Other Coloring Matter; Paints And Ver; Putty And Other Mastic; Inks. | 6.01 | 5.13 | -14.52 |
| 24 | Man-Made Filaments. | 3.13 | 4.48 | 43.31 |
| 25 | Footwear, Gaiters And The Like; Parts Of Such Articles. | 4.31 | 4.35 | 1.03 |
Source Ministry of Commerce and Industry, India