India and Nepal are neighbors and natural trade partners. Nepal is a land locked nation and India if first choice for Import. India exports almost every commodity to Nepal including Mineral fuels, iron, Steel, Vehicles and cereals too name a few. India has trade surplus with Nepal worth 6.1 billions US dollars.
Key Points of India Nepal trade balance in 5 years
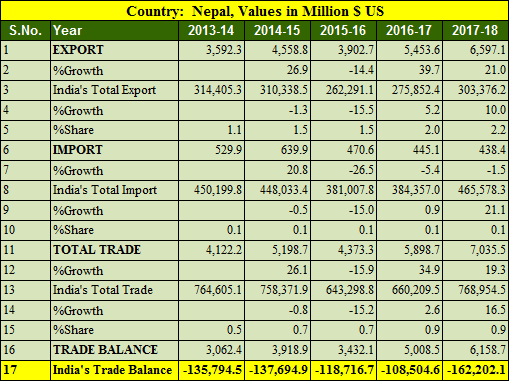
- Export to Nepal increased by 21% in FY 2017-18
- Import from Nepal decreased by 1.5%
- India’s export to Nepal in 5 years is highest in 2017-18 at 6.5 billions USD.
- India’s import from Nepal is highest in 2014-15 at 639.9 millions USD.
- Trade balance is in favor of India in tune of 6.15 billion USD.
- India’s total export was highest in 2013-14 at 314 billion USD in last 5 years.
- India’s import from Nepal is down and it has been decreased by 17.2% since 2013-14
Also Read, India Myanmar trade balance analysis for 5 years : 2013- 2018
Top 25 commodity imported from Nepal by India in 2017-18
| Country: Nepal, Values in Million $ US | ||||
| S.No. | Commodity | 2016-17 | 2017-18 | %Growth |
| 1 | Coffee, Tea, Mate And Spices. | 67.16 | 82.67 | 23.1 |
| 2 | Beverages, Spirits And Vinegar. | 110.1 | 59.28 | -46.16 |
| 3 | Plastic And Articles Thereof. | 44.92 | 43.24 | -3.75 |
| 4 | Iron And Steel | 37.28 | 41.07 | 10.16 |
| 5 | Man-Made Staple Fibers. | 26.45 | 30.01 | 13.44 |
| 6 | Residues And Waste From The Food Industries; Prepared Animal Fodder. | 20.98 | 22.55 | 7.48 |
| 7 | Other Vegetable Textile Fibers; Paper Yarn And Woven Fabrics Of Paper Yarn. | 4.78 | 21.8 | 355.77 |
| 8 | Miscellaneous Chemical Products. | 20.7 | 19.4 | -6.28 |
| 9 | Other Made Up Textile Articles; Sets; Worn Clothing And Worn Textile Articles; Rags | 5.24 | 17.04 | 225.32 |
| 10 | Footwear, Gaiters And The Like; Parts Of Such Articles. | 23.7 | 12.51 | -47.2 |
| 11 | Copper And Articles Thereof. | 9.12 | 9.3 | 2.01 |
| 12 | Essential Oils And Resinous; Perfumery, Cosmetic Or Toilet Preparations. | 8.4 | 8.52 | 1.37 |
| 13 | Pharmaceutical Products | 5.39 | 8.38 | 55.44 |
| 14 | Oil Seeds And Olga. Fruits; Misc. Grains, Seeds And Fruit; Industrial Or Medicinal Plants; Straw And Fodder. | 5.76 | 7.83 | 35.86 |
| 15 | Tanning Or Dyeing Extracts; Tannin And Their Deri. Dyes, Pigments And Other Coloring Matter; Paints And Ver; Putty And Other Mastic’s; Inks. | 4.97 | 7.4 | 49.03 |
| 16 | Pulp Of Wood Or Of Other Fibrous Cellulose Material; Waste And Scrap Of Paper Or Paperboard. | 5.03 | 6.07 | 20.57 |
| 17 | Articles Of Iron Or Steel | 11.47 | 5.5 | -52.09 |
| 18 | Preparations Of Cereals, Flour, Starch Or Milk; Pastry cooks Products. | 6.92 | 4.86 | -29.67 |
| 19 | Vegetable Plaiting Materials; Vegetable Products Not Elsewhere Specified Or Included. | 2.72 | 4.46 | 63.86 |
| 20 | Raw Hides And Skins (Other Than Fur-skins) And Leather | 1.07 | 3.24 | 203.98 |
| 21 | Nuclear Reactors, Boilers, Machinery And Mechanical Appliances; Parts Thereof. | 1.78 | 2.84 | 59.94 |
| 22 | Aluminum And Articles Thereof. | 2.82 | 2.41 | -14.53 |
| 23 | Lead And Articles Thereof. | 0.82 | 2.34 | 183.99 |
| 24 | Wadding, Felt And Non-wovens; Spacial Yarns; Twine, Cordage, Ropes And Cables And Articles Thereof. | 2.39 | 2.32 | -3.14 |
| 25 | Articles Of Apparel And Clothing Accessories, Not Knitted Or Crocheted. | 3.98 | 1.89 | -52.41 |
Top 25 commodities exported to Nepal by India in 2017-18
| Country: Nepal, Values in Million $ US | ||||
| S.No. | Commodity | 2016-17 | 2017-18 | %Growth |
| 1 | Mineral Fuels, Mineral Oils And Products Of Their Distillation; Bituminous Substances; Mineral Waxes. | 1,115.72 | 1,521.50 | 36.37 |
| 2 | Iron And Steel | 627.2 | 880.48 | 40.38 |
| 3 | Vehicles Other Than Railway Or Tramway Rolling Stock, And Parts And Accessories Thereof. | 766.55 | 686.31 | -10.47 |
| 4 | Nuclear Reactors, Boilers, Machinery And Mechanical Appliances; Parts Thereof. | 439.61 | 618.92 | 40.79 |
| 5 | Cereals. | 346.75 | 388.98 | 12.18 |
| 6 | Salt; Sulfur; Earths And Stone; Plastering Materials, Lime And Cement. | 134.43 | 225.13 | 67.48 |
| 7 | Pharmaceutical Products | 179.71 | 201.25 | 11.99 |
| 8 | Plastic And Articles Thereof. | 163.02 | 179.53 | 10.13 |
| 9 | Electrical Machinery And Equipment And Parts Thereof; Sound Recorders And Reproducers, Television Image And Sound Recorders And Reproducers,And Parts. | 158.85 | 142.94 | -10.01 |
| 10 | Residues And Waste From The Food Industries; Prepared Animal Fodder. | 97.25 | 112.19 | 15.36 |
| 11 | Paper And Paperboard; Articles Of Paper Pulp, Of Paper Or Of Paperboard. | 106.74 | 110.55 | 3.57 |
| 12 | Articles Of Iron Or Steel | 88.98 | 88.43 | -0.62 |
| 13 | Rubber And Articles Thereof. | 59.86 | 78.53 | 31.2 |
| 14 | Edible Vegetables And Certain Roots And Tubers. | 117.97 | 74.65 | -36.72 |
| 15 | Essential Oils And Resinous; Perfumery, Cosmetic Or Toilet Preparations. | 63.99 | 69.17 | 8.09 |
| 16 | Ceramic Products. | 40.49 | 55.64 | 37.39 |
| 17 | Aluminum And Articles Thereof. | 34.8 | 53.2 | 52.87 |
| 18 | Preparations Of Cereals, Flour, Starch Or Milk; Pastry cooks Products. | 44.36 | 51.38 | 15.82 |
| 19 | Cotton. | 54.55 | 48.74 | -10.66 |
| 20 | Man-Made Staple Fibers. | 34.26 | 46.13 | 34.65 |
| 21 | Edible Fruit And Nuts; Peel Or Citrus Fruit Or Melons. | 45.04 | 42.81 | -4.95 |
| 22 | Zinc And Articles Thereof. | 16.15 | 42.78 | 164.96 |
| 23 | Miscellaneous Chemical Products. | 36.88 | 42.13 | 14.23 |
| 24 | Sugars And Sugar Confectionery. | 43.73 | 41.45 | -5.22 |
| 25 | Coffee, Tea, Mate And Spices. | 38.28 | 37.58 | -1.81 |
Source Ministry of Commerce and Industry, India