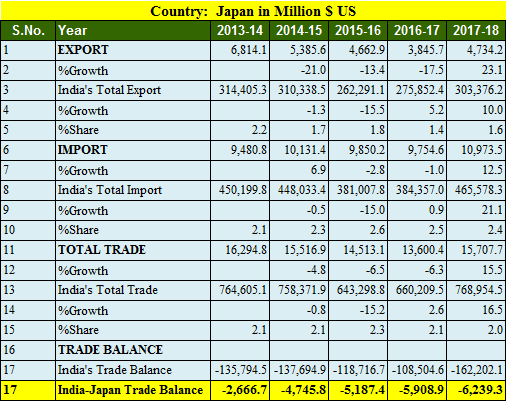
Japan faced world’s worst nuclear attack twice and rebuild itself from scratches. Japan is an important strategic partner for India and provide concessional loan of big projects like Delhi metro. India has trade deficit with Japan in 2017-18 at 6.2billions US dollar. India’s export was 4.7 billion while Import recorded at 10.9 billion USD against Japan.
Key Points of India Japan trade balance in 5 years
- Export to Japan increased by 23.1% in FY 2017-18
- Import from Japan increased by 12.5%
- India’s export to Japan in 5 years is highest in 2013-14 at 6.81 billions USD.
- India’s import from Japan is highest in 2017-18 at 10.9 billions USD.
- Trade balance is in favor of Japan in tune of 6.2 billions USD.
- India’s total export was highest in 2013-14 at 314 billion USD in last 5 years.
- India’s import from Japan is increasing and it has been increased 6% since 2013-14
Also read, India Mauritius International trade
Top 25 commodities Imported from Japan by India in 2017-18
| Country: Japan, Value in Million $ US | ||||
| S.No. | Commodity | 2016-17 | 2017-18 | %Growth |
| 1 | Nuclear Reactors, Boilers, Machinery And Mechanical Appliances; Parts Thereof. | 2,784.12 | 2,669.19 | -4.13 |
| 2 | Electrical Machinery And Equipment And Parts Thereof; Sound Recorders And Reproducers, Television Image And Sound Recorders And Reproducers,And Parts. | 1,141.44 | 1,335.74 | 17.02 |
| 3 | Iron And Steel | 930.55 | 1,169.67 | 25.7 |
| 4 | Plastic And Articles Thereof. | 697.68 | 830.42 | 19.03 |
| 5 | Optical, Photographic Cinematographic Measuring, Checking Precision, Medical Or Surgical Inst. And Apparatus Parts And Accessories Thereof; | 639.6 | 700.88 | 9.58 |
| 6 | Vehicles Other Than Railway Or Tramway Rolling Stock, And Parts And Accessories Thereof. | 573.1 | 637.16 | 11.18 |
| 7 | Organic Chemicals | 419.83 | 471.79 | 12.38 |
| 8 | Ships, Boats And Floating Structures. | 447.34 | 385.2 | -13.89 |
| 9 | Articles Of Iron Or Steel | 377.47 | 317.81 | -15.8 |
| 10 | Rubber And Articles Thereof. | 228.12 | 288.51 | 26.47 |
| 11 | Mineral Fuels, Mineral Oils And Products Of Their Distillation; Bituminous Substances; Mineral Waxes. | 91.96 | 266.4 | 189.69 |
| 12 | Copper And Articles Thereof. | 70.44 | 239.73 | 240.31 |
| 13 | Inorganic Chemicals; Organic Or Inorganic Compounds Of Precious Metals, Of Rare-Earth Metals | 145.37 | 232.39 | 59.87 |
| 14 | Project Goods; Some Special Uses. | 164.54 | 230.56 | 40.13 |
| 15 | Miscellaneous Chemical Products. | 191.59 | 190.81 | -0.41 |
| 16 | Tools Implements, Cutlery, Spoons And Forks, Of Base Metal; Parts Thereof Of Base Metal. | 127.49 | 144.86 | 13.63 |
| 17 | Soap, Organic Surface-Active Agents, Washing Preparations, Lubricating Preparations, Artificial Waxes, Prepared Waxes, Polishing Or Scouring Prep. | 85.74 | 89.09 | 3.91 |
| 18 | Tanning Or Dyeing Extracts; Tannin Dyes, Pigments And Other Coloring Matter; Paints ; Putty And Other Mastic; Inks. | 64.01 | 72.86 | 13.82 |
| 19 | Man-Made Filaments. | 60.04 | 71.57 | 19.21 |
| 20 | Paper And Paperboard; Articles Of Paper Pulp, Of Paper Or Of Paperboard. | 42.45 | 68.09 | 60.43 |
| 21 | Articles Of Stone, Plaster, Cement, Asbestos, Mica Or Similar Materials. | 41.62 | 57.12 | 37.25 |
| 22 | Glass And Glassware. | 27.67 | 44.71 | 61.56 |
| 23 | Photographic Or Cinematographic Goods. | 42.92 | 41.79 | -2.62 |
| 24 | Miscellaneous Manufactured Articles. | 34.03 | 37.95 | 11.52 |
| 25 | Nickel And Articles Thereof. | 36.3 | 35.93 | -1.02 |
Top 25 commodities exported to Japan by India in 2017-18
| Country: Japan,Value in Million $ US | ||||
| S.No. | Commodity | 2016-17 | 2017-18 | %Growth |
| 1 | Fish And Crustaceans, Molluscs And Other Aquatic Invertebrates. | 383.19 | 443.85 | 15.83 |
| 2 | Dairy Produce; Birds’ Eggs; Natural Honey; Edible Prod. Of Animal Origin, Not Elsewhere Spec. Or Included. | 3.54 | 4.2 | 18.66 |
| 3 | Products Of Animal Origin, Not Elsewhere Specified Or Included. | 11.26 | 12.2 | 8.29 |
| 4 | Live Trees And Other Plants; Bulbs; Roots And The Like; Cut Flowers And Ornamental Foliage. | 2.21 | 2.11 | -4.36 |
| 5 | Edible Vegetables And Certain Roots And Tubers. | 2.77 | 3.66 | 32.09 |
| 6 | Edible Fruit And Nuts; Peel Or Citrus Fruit Or Melons. | 61.18 | 95.31 | 55.8 |
| 7 | Coffee, Tea, Mate And Spices. | 42.83 | 39.71 | -7.28 |
| 8 | Cereals. | 4.31 | 5.15 | 19.55 |
| 9 | Products Of The Milling Industry; Malt; Starches; Insulin; Wheat Gluten. | 1.69 | 1.71 | 1.29 |
| 10 | Oil Seeds And Olga. Fruits; Misc. Grains, Seeds And Fruit; Industrial Or Medicinal Plants; Straw And Fodder. | 19.66 | 11.02 | -43.95 |
| 11 | Lac; Gums, Resins And Other Vegetable Saps And Extracts. | 34.67 | 31.01 | -10.55 |
| 12 | Vegetable Plaiting Materials; Vegetable Products Not Elsewhere Specified Or Included. | 6.77 | 9.14 | 35.03 |
| 13 | Animal Or Vegetable Fats And Oils And Their Cleavage Products; Pre. Edible Fats; Animal Or Vegetable Waxes. | 37.19 | 52.67 | 41.61 |
| 14 | Preparations Of Meat, Of Fish Or Of Crustaceans, Molluscs Or Other Aquatic Invertebrates | 5.71 | 4.73 | -17.21 |
| 15 | Sugars And Sugar Confectionery. | 0.02 | 0.01 | -39.55 |
| 16 | Cocoa And Cocoa Preparations. | 0 | 0 | 225 |
| 17 | Preparations Of Cereals, Flour, Starch Or Milk; Pastry cooks Products. | 0.92 | 0.81 | -11.29 |
| 18 | Preparations Of Vegetables, Fruit, Nuts Or Other Parts Of Plants. | 9.68 | 10.06 | 3.91 |
| 19 | Miscellaneous Edible Preparations. | 8.2 | 8.13 | -0.85 |
| 20 | Beverages, Spirits And Vinegar. | 1.05 | 1.2 | 13.54 |
| 21 | Residues And Waste From The Food Industries; Prepared Animal Fodder. | 86.58 | 57.11 | -34.03 |
| 22 | Tobacco And Manufactured Tobacco Substitutes. | 0.19 | 0.25 | 29.23 |
| 23 | Salt; Sulfur; Earths And Stone; Plastering Materials, Lime And Cement. | 31.44 | 40.27 | 28.09 |
| 24 | Ores, Slag And Ash. | 67.14 | 229.68 | 242.11 |
| 25 | Mineral Fuels, Mineral Oils And Products Of Their Distillation; Bituminous Substances; Mineral Waxes. | 564.1 | 866.14 | 53.54 |
Source Ministry of Commerce and Industry, India