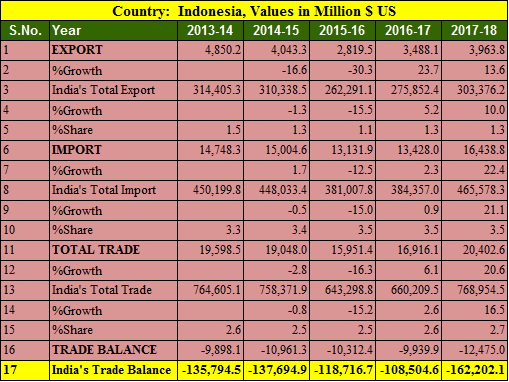
Indonesia is hosting Asian games 2018 in Jakarta and Palembang. This is first time that Asian games scheduled in two cities. India imports mineral fuels, mineral oils along with animal or vegetable fats while exports Vehicles, Iron and Steel primarily. India has trade deficit of 12.47 billions US dollars with Indonesia.
Key Points of India Indonesia trade balance in 5 years
- Export to Indonesia increased by 13.6% in FY 2017-18
- Import from Indonesia increased by 22.4%
- India’s export to Indonesia in 5 years is highest in 2013-14 at 4.85 billions USD.
- India’s import from Indonesia is highest in 2017-18 at 16.43 billions USD.
- Trade balance is in favor of Indonesia in tune of 12.47 billions USD.
- India’s total export was highest in 2013-14 at 314 billion USD in last 5 years.
- India’s import from Indonesia is up and it has been increased by 11.4% since 2013-14
Also Read, India Hong Kong trade balance analysis for 5 years : 2013- 2018
Top 25 commodity imported from Indonesia by India in 2017-18
| Country: Indonesia, Values in Million $ US | ||||
| S.No. | Commodity | 2016-17 | 2017-18 | %Growth |
| 1 | Mineral Fuels, Mineral Oils And Products Of Their Distillation; Bituminous Substances; Mineral Waxes. | 5,036.2 | 6,322.8 | 25.6 |
| 2 | Animal Or Vegetable Fats And Oils And Their Cleavage Products; Pre. Edible Fats; Animal Or Vegetable Waxes. | 4,245.0 | 5,024.8 | 18.4 |
| 3 | Ores, Slag And Ash. | 713.5 | 731.7 | 2.6 |
| 4 | Rubber And Articles Thereof. | 364.7 | 502.1 | 37.7 |
| 5 | Miscellaneous Chemical Products. | 342.2 | 453.0 | 32.4 |
| 6 | Iron And Steel | 235.5 | 298.0 | 26.6 |
| 7 | Organic Chemicals | 152.1 | 247.7 | 62.9 |
| 8 | Paper And Paperboard; Articles Of Paper Pulp, Of Paper Or Of Paperboard. | 173.3 | 233.5 | 34.7 |
| 9 | Ships, Boats And Floating Structures. | 304.7 | 186.1 | -38.9 |
| 10 | Copper And Articles Thereof. | 138.7 | 181.7 | 31.0 |
| 11 | Electrical Machinery And Equipment And Parts Thereof; Sound Recorders And Reproducers, Television Image And Sound Recorders And Reproducers,And Parts. | 162.9 | 175.1 | 7.5 |
| 12 | Nuclear Reactors, Boilers, Machinery And Mechanical Appliances; Parts Thereof. | 148.0 | 173.8 | 17.4 |
| 13 | Natural Or Cultured Pearls,Precious Or Semiprecious Stones,Pre.Metals,Clad With Pre.Metal And Articles, Jewellery;Coin. | 91.3 | 168.0 | 84.0 |
| 14 | Pulp Of Wood Or Of Other Fibrous Cellulose Material; Waste And Scrap Of Paper Or Paperboard. | 118.4 | 148.6 | 25.5 |
| 15 | Tin And Articles Thereof. | 99.8 | 146.2 | 46.5 |
| 16 | Wood And Articles Of Wood; Wood Charcoal. | 99.9 | 139.9 | 40.1 |
| 17 | Vehicles Other Than Railway Or Tramway Rolling Stock, And Parts And Accessories Thereof. | 89.4 | 111.0 | 24.1 |
| 18 | Man-Made Staple Fibres. | 57.5 | 96.7 | 68.3 |
| 19 | Tanning Or Dyeing Extracts; Tannin And Their Deri. Dyes, Pigments And Other Coloring Matter; Paints And Ver; Putty And Other Mastic; Inks. | 66.8 | 89.9 | 34.6 |
| 20 | Coffee, Tea, Mate And Spices. | 109.0 | 88.8 | -18.5 |
| 21 | Pharmaceutical Products | 86.7 | 75.0 | -13.5 |
| 22 | Soap, Organic Surface-Active Agents, Washing Preparations, Lubricating Preparations, Artificial Waxes, Prepared Waxes, Polishing Or Scouring Prep. | 13.0 | 74.4 | 473.9 |
| 23 | Articles Of Iron Or Steel | 30.7 | 72.8 | 137.0 |
| 24 | Inorganic Chemicals; Organic Or Inorganic Compounds Of Precious Metals, Of Rare-Earth Metals, Or Radi. Elem. Or Of Isotopes. | 43.0 | 67.2 | 56.3 |
| 25 | Cocoa And Cocoa Preparations. | 39.8 | 60.7 | 52.6 |
Top 25 commodities exported to Indonesia by India in 2017-18
| Country: Indonesia, Values in Million $ US | ||||
| S.No. | Commodity | 2016-17 | 2017-18 | %Growth |
| 1 | Vehicles Other Than Railway Or Tramway Rolling Stock, And Parts And Accessories Thereof. | 278.0 | 565.4 | 103.4 |
| 2 | Iron And Steel | 300.7 | 540.8 | 79.8 |
| 3 | Organic Chemicals | 374.7 | 425.4 | 13.5 |
| 4 | Nuclear Reactors, Boilers, Machinery And Mechanical Appliances; Parts Thereof. | 271.8 | 373.1 | 37.3 |
| 5 | Oil Seeds And Olga. Fruits; Misc. Grains, Seeds And Fruit; Industrial Or Medicinal Plants; Straw And Fodder. | 229.8 | 251.4 | 9.4 |
| 6 | Mineral Fuels, Mineral Oils And Products Of Their Distillation; Bituminous Substances; Mineral Waxes. | 139.0 | 188.8 | 35.8 |
| 7 | Cotton. | 129.2 | 158.8 | 22.9 |
| 8 | Electrical Machinery And Equipment And Parts Thereof; Sound Recorders And Reproducers, Television Image And Sound Recorders And Reproducers,And Parts. | 122.8 | 145.6 | 18.6 |
| 9 | Tanning Or Dyeing Extracts; Tannin And Their Deri. Dyes, Pigments And Other Coloring Matter; Paints And Ver; Putty And Other Mastic; Inks. | 96.8 | 103.9 | 7.3 |
| 10 | Miscellaneous Chemical Products. | 79.4 | 96.1 | 21.0 |
| 11 | Meat And Edible Meat Offal. | 228.1 | 95.5 | -58.1 |
| 12 | Plastic And Articles Thereof. | 87.0 | 72.9 | -16.2 |
| 13 | Rubber And Articles Thereof. | 53.4 | 69.5 | 30.3 |
| 14 | Pharmaceutical Products | 25.2 | 63.2 | 151.2 |
| 15 | Inorganic Chemicals; Organic Or Inorganic Compounds Of Precious Metals, Of Rare-Earth Metals, Or Radi. Elem. Or Of Isotopes. | 35.6 | 50.4 | 41.3 |
| 16 | Coffee, Tea, Mate And Spices. | 68.5 | 49.9 | -27.2 |
| 17 | Articles Of Iron Or Steel | 48.5 | 48.0 | -1.1 |
| 18 | Aluminum And Articles Thereof. | 65.9 | 46.2 | -29.9 |
| 19 | Essential Oils And Resinous; Perfumery, Cosmetic Or Toilet Preparations. | 43.3 | 43.8 | 1.2 |
| 20 | Copper And Articles Thereof. | 45.9 | 43.3 | -5.6 |
| 21 | Man-Made Filaments. | 32.2 | 37.9 | 17.5 |
| 22 | Ships, Boats And Floating Structures. | 304.5 | 36.1 | -88.2 |
| 23 | Salt; Sulfur; Earths And Stone; Plastering Materials, Lime And Cement. | 36.7 | 33.0 | -10.1 |
| 24 | Man-Made Staple Fibers. | 30.4 | 29.5 | -3.0 |
| 25 | Miscellaneous Edible Preparations. | 11.6 | 26.1 | 125.8 |
Source Ministry of Commerce and Industry, India