
India and china’s total trade in Financial year 2016-17 has been Rs. 4,79,542 crores. Export from India was mere Rs. 68,417 crore. while Import from China in FY was whopping rs. 4,11,124 Crores.

India’s Export to china in FY 2012-13 was Rs. 73,529 crores. which in year 2016-17 declined to rs. 68,417 crores. India’s total export in FY 2012-13 was Rs. 16,34,318 crores. it increased to Rs. 18,52,399 crores in FY 2016-17.
India’s export over previous year has increased by 7.92% in FY 2016-17. China’s export constituted only 3.69 % of total export bill.

India’s Import from china in year 2012-13 was rs. 2,84,384 crores. In FY 2016-17 It has been 4,11,124 Crores. India’s Total Import in FY 2012-13 was rs. 22,29,161 Crores. India’s total Import increased to rs. 25,77,421 in FY 2016-17.
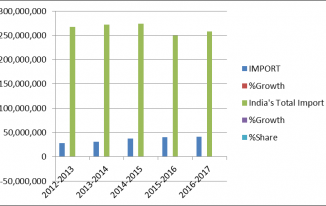
India’s IMPORT over previous year has increased by 3.50% in FY 2016-17. Import from China constituted whopping 15.95 % of total export bill.
Total trade between India and China in 2012-13 was Rs. 3,57,914 Crores which increased to Rs. 4,79,542 in FY 2016-17. India’s total trade in FY 2012-13 was rs. 43,03,480 and it increased to rs. 44,29,761. India’s Total Trade has increased by 5.3 % over previous Financial year.
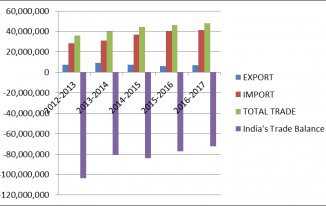
India is having negative trade balance with china since 2012-13, in 2012-13 it was Rs. -10,34,843 crores. In 2016-17 India’s trade balance with china is Rs. -7,25,081crores.
Values in Rs Lacs
| S.No. | Year | 2012-2013 | 2013-2014 | 2014-2015 | 2015-2016 | 2016-2017 |
| 1 | EXPORT | 7,352,956 | 9,056,109 | 7,303,043 | 5,893,274 | 6,841,753 |
| 2 | %Growth | 23.16 | -19.36 | -19.30 | 16.09 | |
| 3 | India’s Total Export | 163,431,829 | 190,501,109 | 189,634,842 | 171,637,805 | 185,233,966 |
| 4 | %Growth | 16.56 | -0.45 | -9.49 | 7.92 | |
| 5 | %Share | 4.50 | 4.75 | 3.85 | 3.43 | 3.69 |
| 6 | IMPORT | 28,438,459 | 30,923,496 | 36,956,536 | 40,404,338 | 41,112,450 |
| 7 | %Growth | 8.74 | 19.51 | 9.33 | 1.75 | |
| 8 | India’s Total Import | 266,916,196 | 271,543,391 | 273,708,658 | 249,029,808 | 257,742,166 |
| 9 | %Growth | 1.73 | 0.80 | -9.02 | 3.50 | |
| 10 | %Share | 10.65 | 11.39 | 13.50 | 16.22 | 15.95 |
| 11 | TOTAL TRADE | 35,791,415 | 39,979,605 | 44,259,579 | 46,297,612 | 47,954,203 |
| 12 | %Growth | 11.70 | 10.71 | 4.60 | 3.58 | |
| 13 | India’s Total Trade | 430,348,025 | 462,044,500 | 463,343,500 | 420,667,613 | 442,976,132 |
| 14 | %Growth | 7.37 | 0.28 | -9.21 | 5.30 | |
| 15 | %Share | 8.32 | 8.65 | 9.55 | 11.01 | 10.83 |
| 16 | TRADE BALANCE | |||||
| 17 | India’s Trade Balance | -103,484,367 | -81,042,282 | -84,073,816 | -77,392,004 | -72,508,200 |
Note: Since 2006-07, Petroleum figures are being computed from Import Daily trade Returns (DTRs) to generate country-wise/port-wise tables. Up to 2005-06 consolidated petroleum import figures were being received from the Petroleum Ministry.
2 Replies to “India and China : 5 years Import export analysis and Trade balance”