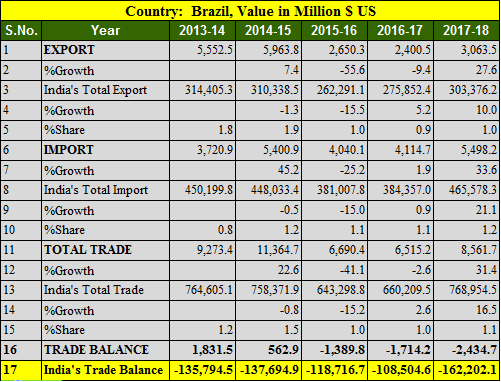
Brazil is football crazy nation with great likes of Pele and Neymar. India Imports Mineral oils, fuels and sugar products primarily from Brazil while exports organic chemical and chemical products. India imported goods worth 5.49 Billion USD and exported in tune of 3.06 billion US dollars. India has trade deficit with Brazil worth 1.6 B USD.
Key Points of India Brazil trade balance in 5 years
- Export to Brazil increased by 27.6% in FY 2017-18
- Import from Brazil increased by 33.6%
- India’s export to Brazil in 5 years is highest in 2014-15 at 5.96 billions USD.
- India’s import from Brazil is highest in 2017-18 at 54.9 billions USD.
- Trade balance is in favor of Brazil in tune of 1.62 billions USD.
- India’s total export was highest in 2013-14 at 314 billion USD in last 5 years.
- India’s import from Brazil is up and it has been increased by 47% since 2013-14
Also Read, India Afghanistan trade balance analysis for 5 years : 2013- 2018
Top 25 commodity imported from Brazil by India in 2017-18
| Country: Brazil, Values in Million $ US | ||||
| S.No. | Commodity | 2016-2017 | 2017-2018 | %Growth |
| 1 | Mineral Fuels, Mineral Oils And Products Of Their Distillation; Bituminous Substances; Mineral Waxes. | 1,383.92 | 1,561.43 | 12.83 |
| 2 | Sugars And Sugar Confectionery. | 1,015.64 | 919.73 | -9.44 |
| 3 | Ores, Slag And Ash. | 278.28 | 627.22 | 125.39 |
| 4 | Aircraft, Spacecraft, And Parts Thereof. | 0.38 | 464.33 | 120,755.62 |
| 5 | Animal Or Vegetable Fats And Oils And Their Cleavage Products; Pre. Edible Fats; Animal Or Vegetable Waxes. | 391.43 | 430.58 | 10 |
| 6 | Natural Or Cultured Pearls,Precious Or Semiprecious Stones,Pre.Metals,Clad With Pre.Metal And Articles Coin. | 84.32 | 288.32 | 241.94 |
| 7 | Iron And Steel | 161.6 | 228.36 | 41.31 |
| 8 | Organic Chemicals | 97.52 | 131.51 | 34.86 |
| 9 | Nuclear Reactors, Boilers, Machinery And Mechanical Appliances; Parts Thereof. | 70.11 | 110.52 | 57.64 |
| 10 | Pharmaceutical Products | 76.46 | 85.38 | 11.67 |
| 11 | Plastic And Articles Thereof. | 112.63 | 83.07 | -26.24 |
| 12 | Wood And Articles Of Wood; Wood Charcoal. | 65.29 | 76.12 | 16.58 |
| 13 | Miscellaneous Chemical Products. | 32.96 | 47.12 | 42.94 |
| 14 | Salt; Sulfur; Earths And Stone; Plastering Materials, Lime And Cement. | 23.95 | 45.48 | 89.89 |
| 15 | Pulp Of Wood Or Of Other Fibrous Cellulose Material; Waste And Scrap Of Paper Or Paperboard. | 18.58 | 42.78 | 130.28 |
| 16 | Edible Vegetables And Certain Roots And Tubers. | 17.62 | 38.36 | 117.69 |
| 17 | Inorganic Chemicals; Organic Or Inorganic Compounds Of Precious Metals, Of Rare-Earth Metals, Or Radi. Elem. Or Of Isotopes. | 7.82 | 32.05 | 310.09 |
| 18 | Rubber And Articles Thereof. | 10 | 29.6 | 195.83 |
| 19 | Vehicles Other Than Railway Or Tramway Rolling Stock, And Parts And Accessories Thereof. | 16.43 | 28.73 | 74.87 |
| 20 | Electrical Machinery And Equipment And Parts Thereof; Sound Recorders And Reproducers, Television Image And Sound Recorders And Reproducers,And Parts. | 15.57 | 27.15 | 74.41 |
| 21 | Essential Oils And Resinous; Perfumery, Cosmetic Or Toilet Preparations. | 16.91 | 23.72 | 40.28 |
| 22 | Optical, Photographic Cinematographic Measuring, Checking Precision, Medical Or Surgical Inst. And Apparatus Parts And Accessories Thereof; | 17.93 | 18.73 | 4.51 |
| 23 | Articles Of Iron Or Steel | 8.08 | 16.26 | 101.23 |
| 24 | Raw Hides And Skins (Other Than Fur skins) And Leather | 20.05 | 15.89 | -20.75 |
| 25 | Cotton. | 15.48 | 13.59 | -12.18 |
Top 25 commodities exported to Brazil by India in 2017-18
| Country: , Brazil Values in Million $ US | ||||
| S.No. | Commodity | 2016-2017 | 2017-2018 | %Growth |
| 1 | Organic Chemicals | 332.46 | 428.17 | 28.79 |
| 2 | Miscellaneous Chemical Products. | 377.19 | 409.03 | 8.44 |
| 3 | Vehicles Other Than Railway Or Tramway Rolling Stock, And Parts And Accessories Thereof. | 163.88 | 277.81 | 69.52 |
| 4 | Nuclear Reactors, Boilers, Machinery And Mechanical Appliances; Parts Thereof. | 205.74 | 277.59 | 34.92 |
| 5 | Man-Made Filaments. | 215.17 | 259.21 | 20.47 |
| 6 | Pharmaceutical Products | 197.86 | 229.24 | 15.86 |
| 7 | Tanning Or Dyeing Extracts; Tann ins And Their Deri. Dyes, Pigments And Other Coloring Matter; Paints And Ver; Putty And Other Mastic; Inks. | 106.38 | 125.31 | 17.8 |
| 8 | Iron And Steel | 51.5 | 90.7 | 76.11 |
| 9 | Rubber And Articles Thereof. | 42.92 | 87.83 | 104.63 |
| 10 | Man-Made Staple Fibers. | 50.76 | 80.13 | 57.86 |
| 11 | Articles Of Iron Or Steel | 51.16 | 72.47 | 41.67 |
| 12 | Aluminum And Articles Thereof. | 52.18 | 72.15 | 38.27 |
| 13 | Articles Of Apparel And Clothing Accessories, Not Knitted Or Crocheted. | 68.52 | 71.16 | 3.85 |
| 14 | Electrical Machinery And Equipment And Parts Thereof; Sound Recorders And Reproducers, Television Image And Sound Recorders And Reproducers,And Parts. | 46.52 | 64.12 | 37.82 |
| 15 | Optical, Photographic Cinematographic Measuring, Checking Precision, Medical Or Surgical Inst. And Apparatus Parts And Accessories Thereof; | 47.32 | 62.12 | 31.27 |
| 16 | Plastic And Articles Thereof. | 54.09 | 57.97 | 7.17 |
| 17 | Ceramic Products. | 26.56 | 35.95 | 35.33 |
| 18 | Mineral Fuels, Mineral Oils And Products Of Their Distillation; Bituminous Substances; Mineral Waxes. | 40.49 | 32.92 | -18.71 |
| 19 | Cotton. | 29.95 | 32.12 | 7.24 |
| 20 | Glass And Glassware. | 19.26 | 22.77 | 18.25 |
| 21 | Soap, Organic Surface-Active Agents, Washing Preparations, Lubricating Preparations, Artificial Waxes, Prepared Waxes, Polishing Or Scouring Prep. | 15.98 | 20.74 | 29.78 |
| 22 | Carpets And Other Textile Floor Coverings. | 12.91 | 19.17 | 48.45 |
| 23 | Coffee, Tea, Mate And Spices. | 14.96 | 18.3 | 22.3 |
| 24 | Inorganic Chemicals; Organic Or Inorganic Compounds Of Precious Metals, Of Rare-Earth Metals, Or Radi. Elem. Or Of Isotopes. | 15.08 | 17.77 | 17.86 |
| 25 | Tools Implements, Cutlery, Spoons And Forks, Of Base Metal; Parts Thereof Of Base Metal. | 12.48 | 17.64 | 41.3 |
Source Ministry of Commerce and Industry, India