India’s Import in Financial year 2017-18 has been Rs. 30 lacs crores. Import bill registered 16.4% growth over previous financial year. In FY 2016-17 it was 25.77 lacs crores. Although PM Narendra Modi is emphasizing on ‘Make in India’ however Import bill is rising like haywire. China is top destination when India look for import, It contribute 16.4% of total import.

Key Points of India’s Import in 2017-18
- Import bill of Financial Year 2017-18 is 30 lacs cores
- In FY 2016-17 India’s total Import was Rs.25.77 lacs crores
- Import bill registered 16.4% growth over FY 2016-17
- Chine is on top with 16.38% import bill
- Top 10 countries contributes 52.26% of import bill
- Due to fall in crude oil price India’s Import fallen from countries like Saudi Arabia and UAE in FY 2017-18 over previous year
- India’s Import reduced from 69 countries
Also Read, Top 50 commodities Imported by India in 2017-18
Review and Analysis
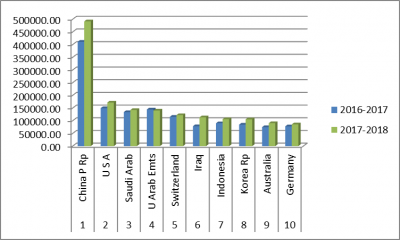
Top 10 countries India imported in 2017-18 included China, USA, Saudi Arabia, United Arab Emirate, Switzerland, Iraq, Indonesia, Korea, Australia and Germany. China was on top with 4.9 lacs crores, followed by USA at Rs. 1.71 lacs crores and on 10th position was Germany with Rs.90 thousand crores.
All the figures are in Rs. crores.

Also read, Top 10 commodities with highest growth in Import bill
While import from each country in top 10 increased in 2017-18, however it was 2.87% down from United Arab Emirates.
| S.No. | Country | 2016-2017 | 2017-2018 | %Growth |
| 1 | China P Rp | 411093.52 | 491542.70 | 19.57 |
| 2 | U S A | 149655.40 | 171565.09 | 14.64 |
| 3 | Saudi Arab | 133945.75 | 142240.74 | 6.19 |
| 4 | U Arab Emts | 144237.12 | 140101.36 | -2.87 |
| 5 | Switzerland | 115619.29 | 122017.94 | 5.53 |
| 6 | Iraq | 78514.95 | 113452.67 | 44.50 |
| 7 | Indonesia | 90081.93 | 105961.14 | 17.63 |
| 8 | Korea Rp | 84404.33 | 105422.76 | 24.90 |
| 9 | Australia | 74864.43 | 90197.26 | 20.48 |
| 10 | Germany | 77704.41 | 85700.23 | 10.29 |
Top 50 countries India Imported from in Financial year 2017 -18
India imported form 229 countries in FY 2017-18, However 93.94% of total import was done from 50 countries. India’s Import from these 50 countries was 28.19 lacs crores.
Also Read, Top 10 commodities with negative growth in Import bills
Top 50 countries import data in rupees crores.
| Country | 2016-2017(Rs. Crores) | 2017-2018 Rs. crore | %Growth |
| China P Rp | 411093.52 | 491542.70 | 19.57 |
| U S A | 149655.40 | 171565.09 | 14.64 |
| Saudi Arab | 133945.75 | 142240.74 | 6.19 |
| U Arab Emts | 144237.12 | 140101.36 | -2.87 |
| Switzerland | 115619.29 | 122017.94 | 5.53 |
| Iraq | 78514.95 | 113452.67 | 44.50 |
| Indonesia | 90081.93 | 105961.14 | 17.63 |
| Korea Rp | 84404.33 | 105422.76 | 24.90 |
| Australia | 74864.43 | 90197.26 | 20.48 |
| Germany | 77704.41 | 85700.23 | 10.29 |
| Iran | 70477.61 | 71620.10 | 1.62 |
| Japan | 65414.52 | 70746.07 | 8.15 |
| Hong Kong | 54906.18 | 68777.76 | 25.26 |
| Nigeria | 51374.53 | 61293.31 | 19.31 |
| Unspecified | 49156.73 | 59995.06 | 22.05 |
| Malaysia | 59881.45 | 58081.29 | -3.01 |
| Russia | 37180.34 | 55287.09 | 48.70 |
| Qatar | 51275.96 | 54210.93 | 5.72 |
| Singapore | 47541.69 | 48132.82 | 1.24 |
| Kuwait | 29899.05 | 46221.01 | 54.59 |
| Thailand | 36313.08 | 45988.60 | 26.64 |
| South Africa | 39116.93 | 44055.78 | 12.63 |
| France | 38263.74 | 42032.43 | 9.85 |
| Belgium | 44395.64 | 38645.73 | -12.95 |
| Venezuela | 36964.29 | 37796.68 | 2.25 |
| Brazil | 27652.62 | 35428.54 | 28.12 |
| Vietnam Soc Rep | 22263.47 | 32356.71 | 45.34 |
| U K | 24583.51 | 30992.24 | 26.07 |
| Canada | 27726.11 | 30479.07 | 9.93 |
| Italy | 26128.45 | 30336.74 | 16.11 |
| Angola | 17406.17 | 27863.28 | 60.08 |
| Oman | 8657.49 | 27500.04 | 217.64 |
| Mexico | 19776.12 | 25329.59 | 28.08 |
| Taiwan | 21076.30 | 25302.69 | 20.05 |
| Ghana | 13015.36 | 17484.30 | 34.34 |
| Netherland | 12729.48 | 16198.91 | 27.26 |
| Peru | 7227.12 | 15331.52 | 112.14 |
| Ukraine | 16656.92 | 15194.49 | -8.78 |
| Argentina | 16763.00 | 14365.07 | -14.30 |
| Turkey | 8096.61 | 13785.05 | 70.26 |
| Chile | 8229.21 | 13477.63 | 63.78 |
| Israel | 13147.33 | 13321.20 | 1.32 |
| Spain | 13223.13 | 10720.54 | -18.93 |
| Botswana | 8766.27 | 10560.69 | 20.47 |
| Sweden | 7788.20 | 9440.37 | 21.21 |
| Finland | 6791.93 | 9022.66 | 32.84 |
| Egypt A Rp | 7810.43 | 8332.69 | 6.69 |
| Algeria | 4055.42 | 8132.19 | 100.53 |
| Zambia | 4991.02 | 7055.80 | 41.37 |
India’s Import in top 50 countries increased in 44 nations compared to previous year while decreased in 6 nations including Spain, Argentina, Ukraine Malaysia and United Arab Emirates.
Also read, Bible of all commodities imported by India in 2016-17 Vs 2017-18
Though India’s Import raised in 2017-18, however India’s Import bill was in negative with 69 countries as compared to Financial year 2016-17.
India’s negative Import bill countries data in Rs. crores.
| Country | 2016-2017 | 2017-2018 | %Growth |
| Tuvalu | 0.84 | 0.01 | -99.08 |
| Marshall Island | 58.64 | 0.71 | -98.79 |
| Samoa | 42.02 | 1.65 | -96.07 |
| Eritrea | 242.24 | 12.64 | -94.78 |
| Virgin Is Us | 30.41 | 1.83 | -93.99 |
| St Kitt N A | 0.05 | 0.00 | -93.95 |
| Aruba | 28.50 | 2.58 | -90.96 |
| Antartica | 3.34 | 0.32 | -90.43 |
| Greenland | 0.69 | 0.07 | -89.94 |
| Netherlandantil | 445.74 | 52.69 | -88.18 |
| Br Virgn Is | 44.99 | 5.65 | -87.44 |
| Moldova | 78.53 | 10.11 | -87.12 |
| Bahamas | 1727.65 | 260.91 | -84.90 |
| Montenegro | 0.36 | 0.06 | -82.19 |
| Somalia | 118.60 | 22.89 | -80.70 |
| Cyprus | 444.83 | 86.79 | -80.49 |
| Panama Republic | 1352.53 | 279.19 | -79.36 |
| Swaziland | 263.50 | 57.58 | -78.15 |
| Trinidad | 1164.33 | 275.76 | -76.32 |
| Bermuda | 0.11 | 0.03 | -75.01 |
| Korea Dp Rp | 591.71 | 161.56 | -72.70 |
| Dominica | 5.24 | 1.77 | -66.23 |
| Nauru Rp | 0.24 | 0.08 | -65.52 |
| Malawi | 277.85 | 106.09 | -61.82 |
| New Caledonia | 161.09 | 62.21 | -61.38 |
| Guyana | 96.73 | 42.53 | -56.03 |
| Mauritania | 73.47 | 35.10 | -52.23 |
| Ecuador | 2384.36 | 1250.30 | -47.56 |
| Timor Leste | 1.17 | 0.61 | -47.50 |
| Fr Guiana | 9.78 | 5.51 | -43.70 |
| Estonia | 687.06 | 390.30 | -43.19 |
| Cameroon | 2411.24 | 1373.31 | -43.05 |
| Myanmar | 7156.12 | 4120.39 | -42.42 |
| Honduras | 148.92 | 85.88 | -42.33 |
| Armenia | 7.04 | 4.18 | -40.60 |
| Maldives | 61.50 | 36.55 | -40.56 |
| Brunei | 4208.47 | 2804.59 | -33.36 |
| Kenya | 699.15 | 467.84 | -33.08 |
| Lithuania | 1819.25 | 1222.90 | -32.78 |
| Ethiopia | 449.02 | 306.09 | -31.83 |
| Malta | 150.07 | 102.93 | -31.41 |
| Guatemala | 145.51 | 102.93 | -29.26 |
| Faroe Is. | 0.05 | 0.03 | -26.06 |
| Turks C Is | 0.21 | 0.16 | -25.04 |
| Bulgaria | 1220.08 | 915.74 | -24.94 |
| Greece | 818.82 | 618.88 | -24.42 |
| Syria | 216.39 | 165.31 | -23.60 |
| Lao Pd Rp | 1390.72 | 1088.01 | -21.77 |
| Uganda | 461.73 | 362.37 | -21.52 |
| Fiji Is | 4.00 | 3.15 | -21.35 |
| Spain | 13223.13 | 10720.54 | -18.93 |
| Georgia | 211.46 | 174.15 | -17.64 |
| Mongolia | 13.35 | 11.10 | -16.86 |
| Chad | 1138.40 | 961.53 | -15.54 |
| Serbia | 182.59 | 155.30 | -14.95 |
| Argentina | 16763.00 | 14365.07 | -14.30 |
| Belgium | 44395.64 | 38645.73 | -12.95 |
| Equtl Guinea | 5352.56 | 4868.61 | -9.04 |
| Ukraine | 16656.92 | 15194.49 | -8.78 |
| Monaco | 7.47 | 6.88 | -7.96 |
| Dominic Rep | 4514.77 | 4172.33 | -7.58 |
| Cote D’ Ivoire | 3056.20 | 2846.86 | -6.85 |
| Bangladesh Pr | 4707.73 | 4419.93 | -6.11 |
| Morocco | 5322.01 | 5025.26 | -5.58 |
| Nepal | 2985.07 | 2824.57 | -5.38 |
| Colombia | 3985.00 | 3823.22 | -4.06 |
| Malaysia | 59881.45 | 58081.29 | -3.01 |
| U Arab Emts | 144237.12 | 140101.36 | -2.87 |
| Zimbabwe | 406.16 | 401.01 | -1.27 |
India’s Import data at a glance country-wise value-wise in 2017-18
| S.No. | Country | 2016-2017 | 2017-2018 | %Growth |
| 1 | Afghanistan Tis | 1967.47 | 2796.62 | 42.14 |
| 2 | Albania | 43.75 | 250.76 | 473.11 |
| 3 | Algeria | 4055.42 | 8132.19 | 100.53 |
| 4 | Ameri Samoa | 0.93 | 1.95 | 110.92 |
| 5 | Andorra | 0.60 | 0.00 | |
| 6 | Angola | 17406.17 | 27863.28 | 60.08 |
| 7 | Anguilla | 0.01 | 1.18 | 15360.10 |
| 8 | Antartica | 3.34 | 0.32 | -90.43 |
| 9 | Antigua | 0.01 | 0.15 | 1520.43 |
| 10 | Argentina | 16763.00 | 14365.07 | -14.30 |
| 11 | Armenia | 7.04 | 4.18 | -40.60 |
| 12 | Aruba | 28.50 | 2.58 | -90.96 |
| 13 | Australia | 74864.43 | 90197.26 | 20.48 |
| 14 | Austria | 6084.98 | 6274.37 | 3.11 |
| 15 | Azerbaijan | 3104.95 | 3827.52 | 23.27 |
| 16 | Bahamas | 1727.65 | 260.91 | -84.90 |
| 17 | Baharain Is | 1950.85 | 2782.94 | 42.65 |
| 18 | Bangladesh Pr | 4707.73 | 4419.93 | -6.11 |
| 19 | Barbados | 1.21 | 1.29 | 6.40 |
| 20 | Belarus | 1142.93 | 1337.82 | 17.05 |
| 21 | Belgium | 44395.64 | 38645.73 | -12.95 |
| 22 | Belize | 3.49 | 8.77 | 151.54 |
| 23 | Benin | 1391.30 | 1436.89 | 3.28 |
| 24 | Bermuda | 0.11 | 0.03 | -75.01 |
| 25 | Bhutan | 2062.99 | 2405.63 | 16.61 |
| 26 | Bolivia | 1166.55 | 4304.03 | 268.95 |
| 27 | Bosnia-Hrzgovin | 22.27 | 56.38 | 153.19 |
| 28 | Botswana | 8766.27 | 10560.69 | 20.47 |
| 29 | Br Virgn Is | 44.99 | 5.65 | -87.44 |
| 30 | Brazil | 27652.62 | 35428.54 | 28.12 |
| 31 | Brunei | 4208.47 | 2804.59 | -33.36 |
| 32 | Bulgaria | 1220.08 | 915.74 | -24.94 |
| 33 | Burkina Faso | 1715.04 | 4081.39 | 137.98 |
| 34 | Burundi | 10.69 | 106.47 | 895.55 |
| 35 | C Afri Rep | 2.54 | 63.68 | 2407.06 |
| 36 | Cambodia | 242.14 | 359.71 | 48.56 |
| 37 | Cameroon | 2411.24 | 1373.31 | -43.05 |
| 38 | Canada | 27726.11 | 30479.07 | 9.93 |
| 39 | Cape Verde Is | 12.77 | 18.16 | 42.25 |
| 40 | Cayman Is | 0.13 | 41.66 | 32688.39 |
| 41 | Chad | 1138.40 | 961.53 | -15.54 |
| 42 | Chile | 8229.21 | 13477.63 | 63.78 |
| 43 | China P Rp | 411093.52 | 491542.70 | 19.57 |
| 44 | Christmas Is. | 0.12 | 4.29 | 3534.91 |
| 45 | Cocos Is | 0.00 | 0.03 | |
| 46 | Colombia | 3985.00 | 3823.22 | -4.06 |
| 47 | Comoros | 172.74 | 240.15 | 39.02 |
| 48 | Congo D. Rep. | 575.87 | 1452.87 | 152.29 |
| 49 | Congo P Rep | 1049.38 | 1283.21 | 22.28 |
| 50 | Cook Is | 0.00 | 0.05 | |
| 51 | Costa Rica | 394.24 | 433.62 | 9.99 |
| 52 | Cote D’ Ivoire | 3056.20 | 2846.86 | -6.85 |
| 53 | Croatia | 170.03 | 206.48 | 21.44 |
| 54 | Cuba | 8.79 | 13.27 | 51.01 |
| 55 | Cyprus | 444.83 | 86.79 | -80.49 |
| 56 | Czech Republic | 3617.61 | 4315.40 | 19.29 |
| 57 | Denmark | 3230.84 | 3640.69 | 12.69 |
| 58 | Djibouti | 18.97 | 35.09 | 84.95 |
| 59 | Dominic Rep | 4514.77 | 4172.33 | -7.58 |
| 60 | Dominica | 5.24 | 1.77 | -66.23 |
| 61 | Ecuador | 2384.36 | 1250.30 | -47.56 |
| 62 | Egypt A Rp | 7810.43 | 8332.69 | 6.69 |
| 63 | El Salvador | 38.71 | 58.23 | 50.43 |
| 64 | Equtl Guinea | 5352.56 | 4868.61 | -9.04 |
| 65 | Eritrea | 242.24 | 12.64 | -94.78 |
| 66 | Estonia | 687.06 | 390.30 | -43.19 |
| 67 | Ethiopia | 449.02 | 306.09 | -31.83 |
| 68 | Faroe Is. | 0.05 | 0.03 | -26.06 |
| 69 | Fiji Is | 4.00 | 3.15 | -21.35 |
| 70 | Finland | 6791.93 | 9022.66 | 32.84 |
| 71 | Fr Guiana | 9.78 | 5.51 | -43.70 |
| 72 | Fr Polynesia | 0.08 | 0.47 | 497.00 |
| 73 | France | 38263.74 | 42032.43 | 9.85 |
| 74 | Gabon | 466.22 | 2547.12 | 446.33 |
| 75 | Gambia | 289.57 | 377.95 | 30.52 |
| 76 | Georgia | 211.46 | 174.15 | -17.64 |
| 77 | Germany | 77704.41 | 85700.23 | 10.29 |
| 78 | Ghana | 13015.36 | 17484.30 | 34.34 |
| 79 | Gibraltar | 0.00 | 0.04 | |
| 80 | Greece | 818.82 | 618.88 | -24.42 |
| 81 | Greenland | 0.69 | 0.07 | -89.94 |
| 82 | Grenada | 0.43 | 1.72 | 297.36 |
| 83 | Guadeloupe | 0.00 | 0.04 | |
| 84 | Guatemala | 145.51 | 102.93 | -29.26 |
| 85 | Guernsey | 0.75 | 1.50 | 99.11 |
| 86 | Guinea | 1874.43 | 3317.43 | 76.98 |
| 87 | Guinea Bissau | 1442.65 | 1651.29 | 14.46 |
| 88 | Guyana | 96.73 | 42.53 | -56.03 |
| 89 | Haiti | 24.21 | 53.21 | 119.82 |
| 90 | Heard Macdonald | 0.00 | 0.00 | |
| 91 | Honduras | 148.92 | 85.88 | -42.33 |
| 92 | Hong Kong | 54906.18 | 68777.76 | 25.26 |
| 93 | Hungary | 1466.34 | 1745.82 | 19.06 |
| 94 | Iceland | 31.57 | 47.78 | 51.35 |
| 95 | Indonesia | 90081.93 | 105961.14 | 17.63 |
| 96 | Iran | 70477.61 | 71620.10 | 1.62 |
| 97 | Iraq | 78514.95 | 113452.67 | 44.50 |
| 98 | Ireland | 3528.14 | 5125.52 | 45.28 |
| 99 | Israel | 13147.33 | 13321.20 | 1.32 |
| 100 | Italy | 26128.45 | 30336.74 | 16.11 |
| 101 | Jamaica | 7.84 | 28.07 | 257.94 |
| 102 | Japan | 65414.52 | 70746.07 | 8.15 |
| 103 | Jordan | 5556.11 | 6348.75 | 14.27 |
| 104 | Kazakhstan | 3473.77 | 5857.10 | 68.61 |
| 105 | Kenya | 699.15 | 467.84 | -33.08 |
| 106 | Korea Dp Rp | 591.71 | 161.56 | -72.70 |
| 107 | Korea Rp | 84404.33 | 105422.76 | 24.90 |
| 108 | Kuwait | 29899.05 | 46221.01 | 54.59 |
| 109 | Kyrghyzstan | 10.01 | 199.34 | 1890.68 |
| 110 | Lao Pd Rp | 1390.72 | 1088.01 | -21.77 |
| 111 | Latvia | 266.25 | 339.10 | 27.36 |
| 112 | Lebanon | 202.53 | 248.11 | 22.51 |
| 113 | Lesotho | 167.18 | 578.36 | 245.95 |
| 114 | Liberia | 51.46 | 236.63 | 359.84 |
| 115 | Libya | 50.01 | 652.70 | 1205.11 |
| 116 | Liechtenstein | 5.76 | 10.30 | 78.95 |
| 117 | Lithuania | 1819.25 | 1222.90 | -32.78 |
| 118 | Luxembourg | 309.59 | 342.85 | 10.74 |
| 119 | Macao | 53.01 | 53.50 | 0.94 |
| 120 | Macedonia | 161.59 | 300.65 | 86.06 |
| 121 | Madagascar | 802.47 | 1079.06 | 34.47 |
| 122 | Malawi | 277.85 | 106.09 | -61.82 |
| 123 | Malaysia | 59881.45 | 58081.29 | -3.01 |
| 124 | Maldives | 61.50 | 36.55 | -40.56 |
| 125 | Mali | 662.10 | 735.66 | 11.11 |
| 126 | Malta | 150.07 | 102.93 | -31.41 |
| 127 | Marshall Island | 58.64 | 0.71 | -98.79 |
| 128 | Mauritania | 73.47 | 35.10 | -52.23 |
| 129 | Mauritius | 123.06 | 133.56 | 8.53 |
| 130 | Mayotte | 0.00 | 0.01 | |
| 131 | Mexico | 19776.12 | 25329.59 | 28.08 |
| 132 | Moldova | 78.53 | 10.11 | -87.12 |
| 133 | Monaco | 7.47 | 6.88 | -7.96 |
| 134 | Mongolia | 13.35 | 11.10 | -16.86 |
| 135 | Montenegro | 0.36 | 0.06 | -82.19 |
| 136 | Montserrat | 0.00 | 0.00 | |
| 137 | Morocco | 5322.01 | 5025.26 | -5.58 |
| 138 | Mozambique | 3662.36 | 6008.65 | 64.07 |
| 139 | Myanmar | 7156.12 | 4120.39 | -42.42 |
| 140 | N. Mariana Is. | 0.20 | 1.12 | 469.56 |
| 141 | Namibia | 337.68 | 401.34 | 18.85 |
| 142 | Nauru Rp | 0.24 | 0.08 | -65.52 |
| 143 | Nepal | 2985.07 | 2824.57 | -5.38 |
| 144 | Netherland | 12729.48 | 16198.91 | 27.26 |
| 145 | Netherlandantil | 445.74 | 52.69 | -88.18 |
| 146 | New Caledonia | 161.09 | 62.21 | -61.38 |
| 147 | New Zealand | 3385.25 | 4151.78 | 22.64 |
| 148 | Nicaragua | 17.61 | 26.82 | 52.28 |
| 149 | Niger | 0.20 | 130.44 | 65720.56 |
| 150 | Nigeria | 51374.53 | 61293.31 | 19.31 |
| 151 | Niue Is | 0.00 | 0.04 | |
| 152 | Norfolk Is | 0.08 | 3.01 | 3902.00 |
| 153 | Norway | 3816.46 | 5425.21 | 42.15 |
| 154 | Oman | 8657.49 | 27500.04 | 217.64 |
| 155 | Pakistan Ir | 3048.77 | 3150.30 | 3.33 |
| 156 | Palau | 0.02 | 5.04 | 20792.17 |
| 157 | Panama C Z | 3.04 | 0.00 | |
| 158 | Panama Republic | 1352.53 | 279.19 | -79.36 |
| 159 | Papua N Gna | 725.50 | 1266.16 | 74.52 |
| 160 | Paraguay | 1041.60 | 1077.41 | 3.44 |
| 161 | Peru | 7227.12 | 15331.52 | 112.14 |
| 162 | Philippines | 3317.87 | 4927.58 | 48.52 |
| 163 | Pitcairn Is. | 0.02 | 1.45 | 7524.58 |
| 164 | Poland | 4637.16 | 4943.50 | 6.61 |
| 165 | Portugal | 946.41 | 1225.13 | 29.45 |
| 166 | Puerto Rico | 334.75 | 482.63 | 44.17 |
| 167 | Qatar | 51275.96 | 54210.93 | 5.72 |
| 168 | Reunion | 93.27 | 116.33 | 24.73 |
| 169 | Romania | 2127.95 | 2655.78 | 24.80 |
| 170 | Russia | 37180.34 | 55287.09 | 48.70 |
| 171 | Rwanda | 7.90 | 34.45 | 336.04 |
| 172 | Samoa | 42.02 | 1.65 | -96.07 |
| 173 | San Marino | 2.59 | 4.16 | 60.48 |
| 174 | Sao Tome | 0.14 | 0.00 | |
| 175 | Saudi Arab | 133945.75 | 142240.74 | 6.19 |
| 176 | Senegal | 2117.86 | 3648.78 | 72.29 |
| 177 | Serbia | 182.59 | 155.30 | -14.95 |
| 178 | Seychelles | 6.22 | 8.83 | 41.98 |
| 179 | Sierra Leone | 82.03 | 155.72 | 89.85 |
| 180 | Singapore | 47541.69 | 48132.82 | 1.24 |
| 181 | Slovak Rep | 459.56 | 614.04 | 33.61 |
| 182 | Slovenia | 681.86 | 722.39 | 5.94 |
| 183 | Solomon Is | 363.54 | 437.02 | 20.21 |
| 184 | Somalia | 118.60 | 22.89 | -80.70 |
| 185 | South Africa | 39116.93 | 44055.78 | 12.63 |
| 186 | South Sudan | 1.18 | 454.13 | 38539.50 |
| 187 | Spain | 13223.13 | 10720.54 | -18.93 |
| 188 | Sri Lanka Dsr | 4039.73 | 4976.54 | 23.19 |
| 189 | St Helena | 0.01 | 0.19 | 1737.31 |
| 190 | St Kitt N A | 0.05 | 0.00 | -93.95 |
| 191 | St Lucia | 1.60 | 2.05 | 28.59 |
| 192 | Sudan | 1636.61 | 2917.30 | 78.25 |
| 193 | Suriname | 308.55 | 598.57 | 94.00 |
| 194 | Swaziland | 263.50 | 57.58 | -78.15 |
| 195 | Sweden | 7788.20 | 9440.37 | 21.21 |
| 196 | Switzerland | 115619.29 | 122017.94 | 5.53 |
| 197 | Syria | 216.39 | 165.31 | -23.60 |
| 198 | Taiwan | 21076.30 | 25302.69 | 20.05 |
| 199 | Tajikistan | 146.39 | 324.09 | 121.39 |
| 200 | Tanzania Rep | 6369.95 | 6634.43 | 4.15 |
| 201 | Thailand | 36313.08 | 45988.60 | 26.64 |
| 202 | Timor Leste | 1.17 | 0.61 | -47.50 |
| 203 | Togo | 928.95 | 1055.25 | 13.60 |
| 204 | Tokelau Is | 0.07 | 0.35 | 396.06 |
| 205 | Tonga | 0.34 | 0.00 | |
| 206 | Trinidad | 1164.33 | 275.76 | -76.32 |
| 207 | Tunisia | 768.59 | 902.64 | 17.44 |
| 208 | Turkey | 8096.61 | 13785.05 | 70.26 |
| 209 | Turkmenistan | 142.86 | 169.02 | 18.31 |
| 210 | Turks C Is | 0.21 | 0.16 | -25.04 |
| 211 | Tuvalu | 0.84 | 0.01 | -99.08 |
| 212 | U Arab Emts | 144237.12 | 140101.36 | -2.87 |
| 213 | U K | 24583.51 | 30992.24 | 26.07 |
| 214 | U S A | 149655.40 | 171565.09 | 14.64 |
| 215 | Uganda | 461.73 | 362.37 | -21.52 |
| 216 | Ukraine | 16656.92 | 15194.49 | -8.78 |
| 217 | Unspecified | 49156.73 | 59995.06 | 22.05 |
| 218 | Uruguay | 90.43 | 160.97 | 78.00 |
| 219 | Us Minor Outlying Islands | 3.74 | 4.80 | 28.41 |
| 220 | Uzbekistan | 312.02 | 658.00 | 110.88 |
| 221 | Vanuatu Rep | 0.00 | 0.00 | |
| 222 | Vatican City | 0.13 | 0.00 | |
| 223 | Venezuela | 36964.29 | 37796.68 | 2.25 |
| 224 | Vietnam Soc Rep | 22263.47 | 32356.71 | 45.34 |
| 225 | Virgin Is Us | 30.41 | 1.83 | -93.99 |
| 226 | Wallis F Is | 0.00 | 0.07 | |
| 227 | Yemen Republc | 32.34 | 979.69 | 2929.12 |
| 228 | Zambia | 4991.02 | 7055.80 | 41.37 |
| 229 | Zimbabwe | 406.16 | 401.01 | -1.27 |