India primarily import mineral oil and fuels from UAE, however also exports natural pearls and precious stones. India and UAE has durable international business relation. India has trade surplus with UAE by 7.4 billion USD in financial year 2017-18.
Key Points of India UAE trade balance in 5 years
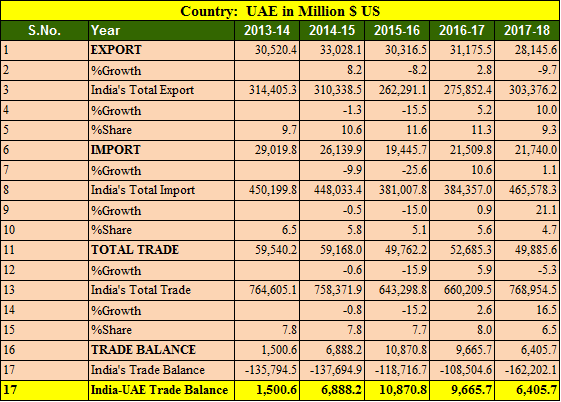
- Export to UAE decreased by 9.7% in FY 2017-18
- Import from UAE increased by 1.1%
- India’s export to UAE in 5 years is highest in 2014-15 at 33.02 billions USD.
- India’s import from UAE is highest in 2013-14 at 29.01 billions USD.
- Trade balance is in favor of India in tune of 6.40 billions USD.
- India’s total export was highest in 2013-14 at 314 billion USD in last 5 years.
- India’s import from UAE is falling and it has been decreased 30% since 2013-14 due to crude oil pricing
Also Read, India Iran trade balance analysis
Top 25 commodity imported from UAE by India in 2017-18
| Country: UAE, Value in Million $ US | ||||
| S.No. | Commodity | 2016-17 | 2017-18 | %Growth |
| 1 | Mineral Fuels, Mineral Oils And Products Of Their Distillation; Bituminous Substances; Mineral Waxes. | 9,457.60 | 9,080.71 | -3.99 |
| 2 | Natural Or Cultured Pearls,Precious Or Semiprecious Stones,Pre.Metals,Clad With Pre.Metal, Coin. | 8,571.03 | 8,703.34 | 1.54 |
| 3 | Plastic And Articles Thereof. | 665.23 | 712.84 | 7.16 |
| 4 | Copper And Articles Thereof. | 495.52 | 551.3 | 11.26 |
| 5 | Iron And Steel | 288.63 | 442.14 | 53.18 |
| 6 | Salt; Sulfur; Earths And Stone; Plastering Materials, Lime And Cement. | 301.59 | 419.92 | 39.24 |
| 7 | Aluminum And Articles Thereof. | 352.85 | 400.17 | 13.41 |
| 8 | Animal Or Vegetable Fats And Oils And Their Cleavage Products; Pre. Edible Fats; Animal Or Vegetable Waxes. | 307.54 | 247.51 | -19.52 |
| 9 | Electrical Machinery And Equipment And Parts Thereof; Sound Recorders And Reproducers, Television Image And Sound Recorders And Reproducers,And Parts. | 181.17 | 152.24 | -15.97 |
| 10 | Articles Of Iron Or Steel | 29.84 | 129.35 | 333.54 |
| 11 | Organic Chemicals | 40.64 | 96.83 | 138.26 |
| 12 | Nuclear Reactors, Boilers, Machinery And Mechanical Appliances; Parts Thereof. | 60.44 | 80.58 | 33.33 |
| 13 | Zinc And Articles Thereof. | 60 | 80.47 | 34.1 |
| 14 | Fertilizers. | 35.58 | 74.2 | 108.54 |
| 15 | Essential Oils And Resinous; Perfumery, Cosmetic Or Toilet Preparations. | 19.39 | 71.03 | 266.38 |
| 16 | Lead And Articles Thereof. | 62.18 | 66.93 | 7.64 |
| 17 | Pulp Of Wood Or Of Other Fibrous Cellulose Material; Waste And Scrap Of Paper Or Paperboard. | 68.38 | 62.51 | -8.58 |
| 18 | Inorganic Chemicals; Organic Or Inorganic Compounds Of Precious Metals, Of Rare-Earth Metals,Elem. Or Of Isotopes. | 59.36 | 47.32 | -20.27 |
| 19 | Ships, Boats And Floating Structures. | 159.3 | 41.8 | -73.76 |
| 20 | Optical, Photographic Cinematographic Measuring, Checking Precision, Medical Or Surgical Inst. And Apparatus Parts And Accessories Thereof; | 28.31 | 27.91 | -1.41 |
| 21 | Edible Fruit And Nuts; Peel Or Citrus Fruit Or Melons. | 16.32 | 20.44 | 25.2 |
| 22 | Other Made Up Textile Articles; Sets; Worn Clothing And Worn Textile Articles; Rags | 10.96 | 16.79 | 53.21 |
| 23 | Glass And Glassware. | 17.89 | 16.73 | -6.47 |
| 24 | Miscellaneous Chemical Products. | 9.7 | 15.43 | 59.07 |
| 25 | Tanning Or Dyeing Extracts; Tannin Dyes, Pigments And Other Coloring Matter; Paints; Putty And Other Mastic; Inks. | 11.99 | 15.16 | 26.46 |
Top 25 commodities exported to UAE by India in 2017-18
| Country: UAE, Value in Million $ US | ||||
| S.No. | Commodity | 2016-17 | 2017-18 | %Growth |
| 1 | Natural Or Cultured Pearls,Precious Or Semiprecious Stones,Pre.Metals,Clad With Pre.Metal ;Coin. | 13,884.06 | 10,832.28 | -21.98 |
| 2 | Mineral Fuels, Mineral Oils And Products Of Their Distillation; Bituminous Substances; Mineral Waxes. | 3,907.11 | 4,662.61 | 19.34 |
| 3 | Articles Of Apparel And Clothing Accessories, Knitted Or Crocheted. | 2,114.92 | 1,603.03 | -24.2 |
| 4 | Articles Of Apparel And Clothing Accessories, Not Knitted Or Crocheted. | 1,817.48 | 1,214.32 | -33.19 |
| 5 | Ships, Boats And Floating Structures. | 1,122.10 | 1,160.27 | 3.4 |
| 6 | Iron And Steel | 516.04 | 711.58 | 37.89 |
| 7 | Nuclear Reactors, Boilers, Machinery And Mechanical Appliances; Parts Thereof. | 635.31 | 710.05 | 11.76 |
| 8 | Electrical Machinery And Equipment And Parts Thereof; Sound Recorders And Reproducers, Television Image And Sound Recorders And Reproducers,And Parts. | 662.67 | 683.05 | 3.08 |
| 9 | Cereals. | 616.39 | 595.23 | -3.43 |
| 10 | Organic Chemicals | 230.98 | 417.03 | 80.55 |
| 11 | Articles Of Iron Or Steel | 516.53 | 416.47 | -19.37 |
| 12 | Edible Fruit And Nuts; Peel Or Citrus Fruit Or Melons. | 366.55 | 353.43 | -3.58 |
| 13 | Copper And Articles Thereof. | 307.19 | 340.43 | 10.82 |
| 14 | Plastic And Articles Thereof. | 282.93 | 322.97 | 14.15 |
| 15 | Vehicles Other Than Railway Or Tramway Rolling Stock, And Parts And Accessories Thereof. | 268.35 | 318.01 | 18.51 |
| 16 | Inorganic Chemicals; Organic Or Inorganic Compounds Of Precious Metals, Of Rare-Earth Metals | 208.01 | 303.44 | 45.87 |
| 17 | Fish And Crustaceans, Molluscs And Other Aquatic Invertebrates. | 167.31 | 193.95 | 15.93 |
| 18 | Coffee, Tea, Mate And Spices. | 152.65 | 172.84 | 13.23 |
| 19 | Paper And Paperboard; Articles Of Paper Pulp, Of Paper Or Of Paperboard. | 114.71 | 165.66 | 44.42 |
| 20 | Meat And Edible Meat Offal. | 177.24 | 162.93 | -8.08 |
| 21 | Other Made Up Textile Articles; Sets; Worn Clothing And Worn Textile Articles; Rags | 153.12 | 161.17 | 5.25 |
| 22 | Essential Oils And Resinous; Perfumery, Cosmetic Or Toilet Preparations. | 141.84 | 160.49 | 13.15 |
| 23 | Edible Vegetables And Certain Roots And Tubers. | 152.46 | 151.37 | -0.72 |
| 24 | Man-Made Filaments. | 201.16 | 149.92 | -25.47 |
| 25 | Tobacco And Manufactured Tobacco Substitutes. | 131.91 | 138.03 | 4.64 |
Source Ministry of Commerce and Industry, India