Singapore is an island nation with area less than Delhi and 5.6 million population. However due to favorable business policy and strategic location it play a key role in international trade. India exported goods worth 10.2 billions USD and imported 7.4 billions USD with a trade surplus of 2.7 billion dollars in FY 2017-18.
Key Points of India Singapore trade balance in 5 years
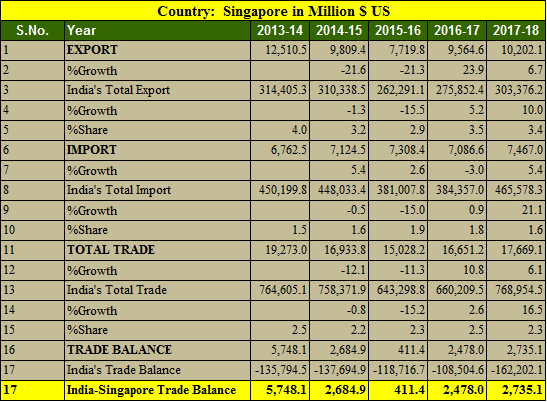
- Export to Singapore increased by 6.7% in FY 2017-18
- Import from Singapore increased by 5.4%
- India’s export to Singapore in 5 years is highest in 2013-14 at 10.2 billions USD.
- India’s import from Singapore is highest in 2017-18 at 7.4 billions USD.
- Trade balance is in favor of India in tune of 2.73 billions USD.
- India’s total export was highest in 2013-14 at 314 billion USD in last 5 years.
- India’s import from Singapore is increasing and it has been increased 10.4% since 2013-14
Also read, Rafale deal left trade deficit with France
Top 25 Commodities Imported from Singapore in 2017-18
| Country: Singapore in Million $ US | ||||
| S.No. | Commodity | 2016-17 | 2017-18 | %Growth |
| 1 | Organic Chemicals | 1,151.38 | 1,500.27 | 30.3 |
| 2 | Electrical Machinery And Equipment And Parts Thereof; Sound Recorders And Reproducers, Television Image And Sound Recorders And Reproducers,And Parts. | 1,109.49 | 1,204.47 | 8.56 |
| 3 | Nuclear Reactors, Boilers, Machinery And Mechanical Appliances; Parts Thereof. | 1,108.38 | 1,096.45 | -1.08 |
| 4 | Plastic And Articles Thereof. | 696.68 | 912.01 | 30.91 |
| 5 | Mineral Fuels, Mineral Oils And Products Of Their Distillation; Bituminous Substances; Mineral Waxes. | 628.18 | 530.24 | -15.59 |
| 6 | Natural Or Cultured Pearls,Precious Or Semiprecious Stones,Pre.Metals,Clad With Pre.Metal, Coin. | 420.98 | 492.11 | 16.9 |
| 7 | Optical, Photographic Cinematographic Measuring, Checking Precision, Medical Or Surgical Inst. And Apparatus Parts And Accessories Thereof; | 369.92 | 430.7 | 16.43 |
| 8 | Ships, Boats And Floating Structures. | 723.05 | 288.16 | -60.15 |
| 9 | Miscellaneous Chemical Products. | 197.48 | 224.81 | 13.84 |
| 10 | Iron And Steel | 166.38 | 171.3 | 2.96 |
| 11 | Rubber And Articles Thereof. | 80.03 | 84.25 | 5.28 |
| 12 | Aluminum And Articles Thereof. | 43.91 | 58.03 | 32.14 |
| 13 | Tanning Or Dyeing Extracts; Tannin Dyes, Pigments And Other Coloring Matter; Paints; Putty And Other Mastic; Inks. | 44.39 | 55.29 | 24.55 |
| 14 | Aircraft, Spacecraft, And Parts Thereof. | 15.65 | 47.25 | 201.82 |
| 15 | Pharmaceutical Products | 20.17 | 43.09 | 113.68 |
| 16 | Articles Of Iron Or Steel | 31.15 | 38.31 | 23 |
| 17 | Man-Made Filaments. | 19.63 | 25.17 | 28.21 |
| 18 | Beverages, Spirits And Vinegar. | 20.04 | 24.4 | 21.74 |
| 19 | Paper And Paperboard; Articles Of Paper Pulp, Of Paper Or Of Paperboard. | 21.57 | 20.91 | -3.04 |
| 20 | Furniture; Bedding, Mattresses, Mattress Supports, Cushions And Similar Stuffed Furnishing; Lamps And Lighting Fittings Not Elsewhere Specified Or Inc | 13.84 | 17.53 | 26.63 |
| 21 | Cocoa And Cocoa Preparations. | 19.64 | 17.2 | -12.39 |
| 22 | Soap, Organic Surface-Active Agents, Washing Preparations, Lubricating Preparations, Artificial Waxes, Prepared Waxes, Polishing Or Scouring Prep. | 17.51 | 16.4 | -6.34 |
| 23 | Printed Books, Newspapers, Pictures And Other Products Of The Printing Industry; Manuscripts, Typescripts And Plans. | 12.52 | 15.19 | 21.32 |
| 24 | Pulp Of Wood Or Of Other Fibrous Cellulose Material; Waste And Scrap Of Paper Or Paperboard. | 8.21 | 14.01 | 70.75 |
| 25 | Essential Oils And Resinous; Perfumery, Cosmetic Or Toilet Preparations. | 16.14 | 13.22 | -18.05 |
Top 25 commodities exported to Singapore by India in 2017-18
| Country: Singapore, values in Million $ US | ||||
| S.No. | Commodity | 2016-17 | 2017-18 | %Growth |
| 1 | Mineral Fuels, Mineral Oils And Products Of Their Distillation; Bituminous Substances; Mineral Waxes. | 4,757.42 | 6,179.20 | 29.89 |
| 2 | Ships, Boats And Floating Structures. | 1,590.68 | 675.17 | -57.55 |
| 3 | Natural Or Cultured Pearls,Precious Or Semiprecious Stones,Pre.Metals,Clad With Pre.Metal ;Coin. | 564.94 | 560.25 | -0.83 |
| 4 | Nuclear Reactors, Boilers, Machinery And Mechanical Appliances; Parts Thereof. | 382.39 | 513.07 | 34.17 |
| 5 | Organic Chemicals | 325.48 | 369.29 | 13.46 |
| 6 | Aircraft, Spacecraft, And Parts Thereof. | 263.59 | 249.63 | -5.3 |
| 7 | Electrical Machinery And Equipment And Parts Thereof; Sound Recorders And Reproducers, Television Image And Sound Recorders And Reproducers,And Parts. | 234.02 | 232.58 | -0.61 |
| 8 | Optical, Photographic Cinematographic Measuring, Checking Precision, Medical Or Surgical Inst. And Apparatus Parts And Accessories Thereof; | 154.98 | 167.35 | 7.98 |
| 9 | Copper And Articles Thereof. | 292.58 | 152.24 | -47.97 |
| 10 | Iron And Steel | 36.55 | 110 | 200.97 |
| 11 | Aluminum And Articles Thereof. | 58.63 | 86.17 | 46.98 |
| 12 | Tanning Or Dyeing Extracts; Tannin Dyes, Pigments And Other Coloring Matter; Paints ; Putty And Other Mastic; Inks. | 61.11 | 82.8 | 35.49 |
| 13 | Essential Oils And Resinous; Perfumery, Cosmetic Or Toilet Preparations. | 71.19 | 76.2 | 7.04 |
| 14 | Pharmaceutical Products | 56.55 | 65.94 | 16.59 |
| 15 | Cereals. | 54.54 | 50.9 | -6.66 |
| 16 | Articles Of Iron Or Steel | 37.55 | 45.26 | 20.54 |
| 17 | Fish And Crustaceans, Molluscs And Other Aquatic Invertebrates. | 41.72 | 40.19 | -3.65 |
| 18 | Vehicles Other Than Railway Or Tramway Rolling Stock, And Parts And Accessories Thereof. | 36.05 | 39.29 | 8.97 |
| 19 | Plastic And Articles Thereof. | 32.46 | 38.26 | 17.85 |
| 20 | Miscellaneous Chemical Products. | 43.11 | 34.54 | -19.88 |
| 21 | Articles Of Apparel And Clothing Accessories, Not Knitted Or Crocheted. | 35.72 | 31.41 | -12.08 |
| 22 | Beverages, Spirits And Vinegar. | 20.22 | 31.19 | 54.26 |
| 23 | Paper And Paperboard; Articles Of Paper Pulp, Of Paper Or Of Paperboard. | 20.4 | 22.44 | 10.02 |
| 24 | Edible Vegetables And Certain Roots And Tubers. | 23.13 | 21.99 | -4.95 |
| 25 | Articles Of Apparel And Clothing Accessories, Knitted Or Crocheted. | 16.14 | 20.76 | 28.57 |
Source Ministry of Commerce and Industry, India