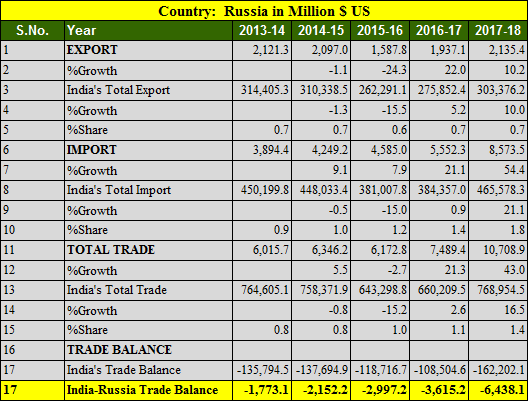
India and Russia has been friend in all seasons. India has been depending on Russia for new generation arms and equipment. Still Indian army uses war machinery imported from Russia on large scale. India imported good worth 8.5 billions US dollar and exported 2.11 billions value commodity. India has trade deficit with Russia at 6.4 billions USD.
Key Points of India Russia trade balance in 5 years
- Export to Russia increased by 10.2% in FY 2017-18
- Import from Russia increased by 54.4%
- India’s export to Russia in 5 years is highest in 2017-18 at 2.13 billions USD.
- India’s import from Russia is highest in 2017-18 at 8.57 billions USD.
- Trade balance is in favor of Russia in tune of 6.4 billions USD.
- India’s total export was highest in 2013-14 at 314 billion USD in last 5 years.
- India’s import from Russia is increasing and it has been increased 120% since 2013-14
Also Read, India USA trade balance analysis for 5 years : 2013- 2018
Review and Analysis of India Russia trade balance
Russia is largest producer of natural pearls and precious stones. India being hub of precious stones imports from Russia in tune of 3.9 billion USD. India also imports from Russia various commodities including Mineral fuels, mineral oils, fertilizers, project good etc.
Top 25 commodities imported from Russia in 2017-18
| Country: Russia, Value in Million $ US | ||||
| S.No. | Commodity | 2016-17 | 2017-18 | %Growth |
| 1 | Natural Or Cultured Pearls,Precious Or Semiprecious Stones,Pre.Metals,Clad With Pre.Metal And Artcls Thereof;Imit.Jewlry;Coin. | 2,475.83 | 3,947.58 | 59.44 |
| 2 | Mineral Fuels, Mineral Oils And Products Of Their Distillation; Bituminous Substances; Mineral Waxes. | 895.84 | 2,103.53 | 134.81 |
| 3 | Fertilisers. | 359.91 | 410.89 | 14.16 |
| 4 | Paper And Paperboard; Articles Of Paper Pulp, Of Paper Or Of Paperboard. | 230.96 | 276.78 | 19.84 |
| 5 | Project Goods; Some Special Uses. | 92.13 | 262.45 | 184.85 |
| 6 | Iron And Steel | 247.99 | 206.79 | -16.61 |
| 7 | Edible Vegetables And Certain Roots And Tubers. | 181.2 | 199.42 | 10.06 |
| 8 | Rubber And Articles Thereof. | 113 | 152.01 | 34.52 |
| 9 | Organic Chemicals | 63.44 | 120.07 | 89.27 |
| 10 | Inorganic Chemicals; Organic Or Inorganic Compounds Of Precious Metals, Of Rare-Earth Metals, Or Radi. Elem. Or Of Isotopes. | 96.5 | 119.64 | 23.98 |
| 11 | Salt; Sulphur; Earths And Stone; Plastering Materials, Lime And Cement. | 116.1 | 113.36 | -2.35 |
| 12 | Nuclear Reactors, Boilers, Machinery And Mechanical Appliances; Parts Thereof. | 126.74 | 98.09 | -22.61 |
| 13 | Plastic And Articles Thereof. | 72.81 | 90.18 | 23.86 |
| 14 | Cereals. | 34.13 | 86.87 | 154.49 |
| 15 | Nickel And Articles Thereof. | 70.1 | 61.35 | -12.48 |
| 16 | Printed Bookds, Newspapers, Pictures And Other Products Of The Printing Industry; Manuscripts, Typescripts And Plans. | 46.85 | 59.23 | 26.41 |
| 17 | Optical, Photographic Cinematographic Measuring, Checking Precision, Medical Or Surgical Inst. And Apparatus Parts And Accessories Thereof; | 10.52 | 32.48 | 208.74 |
| 18 | Aircraft, Spacecraft, And Parts Thereof. | 35.85 | 31.63 | -11.78 |
| 19 | Electrical Machinery And Equipment And Parts Thereof; Sound Recorders And Reproducers, Television Image And Sound Recorders And Reproducers,And Parts. | 18.2 | 22.97 | 26.21 |
| 20 | Pulp Of Wood Or Of Other Fibrous Cellulosic Material; Waste And Scrap Of Paper Or Paperboard. | 25 | 21.08 | -15.71 |
| 21 | Articles Of Iron Or Steel | 17.97 | 14.36 | -20.1 |
| 22 | Wood And Articles Of Wood; Wood Charcoal. | 12.11 | 14.09 | 16.34 |
| 23 | Miscellaneous Chemical Products. | 23.84 | 13.88 | -41.8 |
| 24 | Ships, Boats And Floating Structures. | 6.03 | 13.71 | 127.36 |
| 25 | Other Base Metals; Cermets; Articles Thereof. | 8.87 | 13.5 | 52.2 |
India is getting reputation for organic medicines. Organic medicines are demanded all over world. India exports Russia Pharmaceutical products as leading commodity. It is followed by nuclear reactors, organic chemicals, coffee, tea, mate and spices.
Top 25 commodities exported by India to Russia
| Country: Russia in Million $ US | ||||
| S.No. | Commodity | 2016-17 | 2017-18 | %Growth |
| 1 | Pharmaceutical Products | 351.05 | 408.93 | 16.49 |
| 2 | Nuclear Reactors, Boilers, Machinery And Mechanical Appliances; Parts Thereof. | 221.13 | 203.28 | -8.07 |
| 3 | Organic Chemicals | 94.9 | 143.87 | 51.61 |
| 4 | Coffee, Tea, Mate And Spices. | 124.45 | 139.51 | 12.1 |
| 5 | Vehicles Other Than Railway Or Tramway Rolling Stock, And Parts And Accessories Thereof. | 70.44 | 122.37 | 73.71 |
| 6 | Fish And Crustaceans, Molluscs And Other Aquatic Invertabrates. | 58.02 | 80.51 | 38.76 |
| 7 | Iron And Steel | 62.21 | 74.2 | 19.28 |
| 8 | Miscellaneous Edible Preparations. | 68.63 | 62.06 | -9.56 |
| 9 | Electrical Machinery And Equipment And Parts Thereof; Sound Recorders And Reproducers, Television Image And Sound Recorders And Reproducers,And Parts. | 72.95 | 60.27 | -17.38 |
| 10 | Meat And Edible Meat Offal. | 27.21 | 50.49 | 85.53 |
| 11 | Edible Fruit And Nuts; Peel Or Citrus Fruit Or Melons. | 44.65 | 49.17 | 10.12 |
| 12 | Articles Of Apparel And Clothing Accessories, Not Knitted Or Crocheted. | 30.76 | 45.71 | 48.6 |
| 13 | Oil Seeds And Olea. Fruits; Misc. Grains, Seeds And Fruit; Industrial Or Medicinal Plants; Straw And Fodder. | 39.28 | 44.27 | 12.7 |
| 14 | Miscellaneous Chemical Products. | 36.13 | 43.27 | 19.75 |
| 15 | Lac; Gums, Resins And Other Vegetable Saps And Extracts. | 28.27 | 41.69 | 47.49 |
| 16 | Aircraft, Spacecraft, And Parts Thereof. | 111.53 | 40.35 | -63.82 |
| 17 | Rubber And Articles Thereof. | 26.75 | 38.65 | 44.49 |
| 18 | Articles Of Apparel And Clothing Accessories, Knitted Or Corcheted. | 37.91 | 37.34 | -1.51 |
| 19 | Footwear, Gaiters And The Like; Parts Of Such Articles. | 30.21 | 33.15 | 9.71 |
| 20 | Plastic And Articles Thereof. | 23.38 | 30.18 | 29.08 |
| 21 | Tobacco And Manufactured Tobacco Substitutes. | 32.51 | 25.52 | -21.52 |
| 22 | Cereals. | 32.29 | 25.24 | -21.83 |
| 23 | Tanning Or Dyeing Extracts; Tannins And Their Deri. Dyes, Pigments And Other Colouring Matter; Paints And Ver; Putty And Other Mastics; Inks. | 21.45 | 25.19 | 17.44 |
| 24 | Preparations Of Vegetables, Fruit, Nuts Or Other Parts Of Plants. | 16.63 | 24.72 | 48.65 |
| 25 | Articles Of Iron Or Steel | 19.78 | 21.7 | 9.66 |
Source Ministry of Commerce and Industry, India