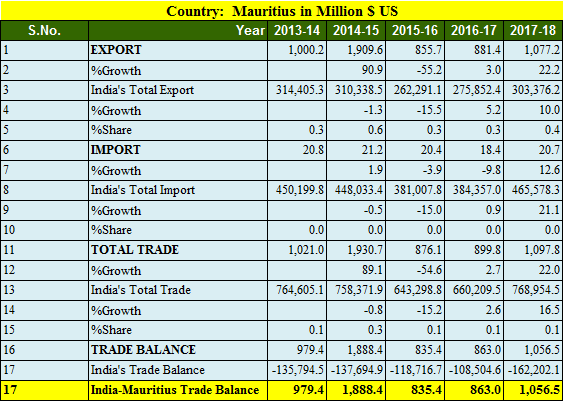
Mauritius is an Indian ocean island nation with majority of Indian descendants. It has 1.3 million population and was one of the preferred nation for investment in India. India has trade surplus with Mauritius, In Financial year India exported good worth 1.07 billion US dollars and imported 20.7 million USD with aa trade surplus of 1.05 billion USD.
Key Points of India Mauritius trade balance in 5 years
- Export to Mauritius increased by 22.2% in FY 2017-18
- Import from Mauritius increased by 12.6%
- India’s export to Mauritius in 5 years is highest in 2014-15 at 1.9 billions USD.
- India’s import from Mauritius is highest in 2014-15 at 21.2 millions USD.
- Trade balance is in favor of India in tune of 1.05 billions USD.
- India’s total export was highest in 2013-14 at 314 billion USD in last 5 years.
- India’s import from Mauritius is stable at 20 million USD
Also read, India Singapore trade balance analysis
Top 25 commodities Imported from Mauritius in 2017-18
| Country: Mauritius, values in Million $ US | ||||
| S.No. | Commodity | 2016-17 | 2017-18 | %Growth |
| 1 | Optical, Photographic Cinematographic Measuring, Checking Precision, Medical Or Surgical Inst. And Apparatus Parts And Accessories Thereof; | 7.11 | 9.23 | 29.81 |
| 2 | Copper And Articles Thereof. | 0.62 | 2.85 | 356.22 |
| 3 | Aluminum And Articles Thereof. | 1.66 | 2.05 | 23.56 |
| 4 | Pulp Of Wood Or Of Other Fibrous Cellulose Material; Waste And Scrap Of Paper Or Paperboard. | 1.48 | 1.53 | 3.42 |
| 5 | Electrical Machinery And Equipment And Parts Thereof; Sound Recorders And Reproducers, Television Image And Sound Recorders And Reproducers,And Parts. | 1.47 | 1.29 | -12.28 |
| 6 | Articles Of Apparel And Clothing Accessories, Not Knitted Or Crocheted. | 1.15 | 0.79 | -31.65 |
| 7 | Natural Or Cultured Pearls,Precious Or Semiprecious Stones,Pre.Metals,Clad With Pre.Metal And Coin. | 0.44 | 0.73 | 65.83 |
| 8 | Nuclear Reactors, Boilers, Machinery And Mechanical Appliances; Parts Thereof. | 0.44 | 0.66 | 49.89 |
| 9 | Iron And Steel | 2.62 | 0.46 | -82.52 |
| 10 | Plastic And Articles Thereof. | 0.18 | 0.35 | 95.27 |
| 11 | Cotton. | 0.14 | 0.12 | -14.35 |
| 12 | Zinc And Articles Thereof. | 0.15 | 0.12 | -15.25 |
| 13 | Project Goods; Some Special Uses. | 0.06 | 0.08 | 48.64 |
| 14 | Ceramic Products. | 0 | 0.07 | 3,142.86 |
| 15 | Printed Books, Newspapers, Pictures And Other Products Of The Printing Industry; Manuscripts, Typescripts And Plans. | 0 | 0.06 | 8,342.86 |
| 16 | Lead And Articles Thereof. | 0.05 | ||
| 17 | Furniture; Bedding, Mattresses, Mattress Supports, Cushions And Similar Stuffed Furnishing; Lamps And Lighting Fittings Not Elsewhere Specified Or Inc | 0 | 0.04 | 992.31 |
| 18 | Miscellaneous Manufactured Articles. | 0.03 | 0.04 | 31.49 |
| 19 | Tools Implements, Cutlery, Spoons And Forks, Of Base Metal; Parts Thereof Of Base Metal. | 0 | 0.03 | 2,545.45 |
| 20 | Paper And Paperboard; Articles Of Paper Pulp, Of Paper Or Of Paperboard. | 0.03 | 0.02 | -29.48 |
| 21 | Man-Made Filaments. | 0.02 | ||
| 22 | Other Made Up Textile Articles; Sets; Worn Clothing And Worn Textile Articles; Rags | 0.03 | 0.02 | -51.34 |
| 23 | Oil Seeds And Olga. Fruits; Misc. Grains, Seeds And Fruit; Industrial Or Medicinal Plants; Straw And Fodder. | 0.03 | 0.01 | -59.27 |
| 24 | Preparations Of Cereals, Flour, Starch Or Milk; Pastry cooks Products. | 0.01 | ||
| 25 | Man-Made Staple Fibers. | 0.01 | ||
Top 25 commodities exported to Mauritius by India in 2017-18
| Country: Mauritius, Value in Million $ US | ||||
| S.No. | Commodity | 2016-17 | 2017-18 | %Growth |
| 1 | Mineral Fuels, Mineral Oils And Products Of Their Distillation; Bituminous Substances; Mineral Waxes. | 483.81 | 670.63 | 38.61 |
| 2 | Cotton. | 40.24 | 57.01 | 41.68 |
| 3 | Cereals. | 29.24 | 40.27 | 37.74 |
| 4 | Ships, Boats And Floating Structures. | 72.52 | 38.46 | -46.97 |
| 5 | Articles Of Apparel And Clothing Accessories, Not Knitted Or Crocheted. | 36.93 | 29.24 | -20.83 |
| 6 | Pharmaceutical Products | 28.24 | 28.44 | 0.7 |
| 7 | Plastic And Articles Thereof. | 8.48 | 21.18 | 149.81 |
| 8 | Vehicles Other Than Railway Or Tramway Rolling Stock, And Parts And Accessories Thereof. | 16.43 | 18.45 | 12.25 |
| 9 | Nuclear Reactors, Boilers, Machinery And Mechanical Appliances; Parts Thereof. | 10.9 | 17.67 | 62.09 |
| 10 | Electrical Machinery And Equipment And Parts Thereof; Sound Recorders And Reproducers, Television Image And Sound Recorders And Reproducers,And Parts. | 12.05 | 13.85 | 14.93 |
| 11 | Fish And Crustaceans, Molluscs And Other Aquatic Invertebrates. | 10.92 | 13.08 | 19.76 |
| 12 | Meat And Edible Meat Offal. | 9.64 | 10.07 | 4.48 |
| 13 | Man-Made Filaments. | 8.77 | 9.71 | 10.68 |
| 14 | Edible Vegetables And Certain Roots And Tubers. | 6.74 | 7.56 | 12.08 |
| 15 | Man-Made Staple Fibers. | 6.17 | 7.11 | 15.13 |
| 16 | Articles Of Iron Or Steel | 3.45 | 5.61 | 62.67 |
| 17 | Iron And Steel | 3.87 | 5.22 | 34.86 |
| 18 | Other Made Up Textile Articles; Sets; Worn Clothing And Worn Textile Articles; Rags | 4.98 | 5.05 | 1.51 |
| 19 | Articles Of Apparel And Clothing Accessories, Knitted Or Crocheted. | 5.61 | 4.92 | -12.25 |
| 20 | Knitted Or Crocheted Fabrics. | 3.13 | 4.26 | 36.21 |
| 21 | Paper And Paperboard; Articles Of Paper Pulp, Of Paper Or Of Paperboard. | 2.63 | 4.01 | 52.49 |
| 22 | Footwear, Gaiters And The Like; Parts Of Such Articles. | 3.62 | 3.74 | 3.21 |
| 23 | Ceramic Products. | 3.58 | 3.69 | 3.19 |
| 24 | Sugars And Sugar Confectionery. | 1.1 | 3.57 | 222.95 |
| 25 | Essential Oils And Resinous; Perfumery, Cosmetic Or Toilet Preparations. | 3.69 | 3.42 | -7.28 |
Source Ministry of Commerce and Industry, India