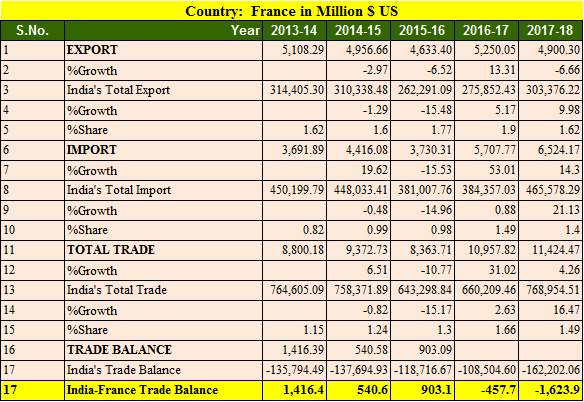
India and France are in cross hair by opposition parties over Rafale fighter plan deal. India is importing fighter plan for an amount undisclosed by either party. As war machinery and equipment deal is happening India has trade deficit with France. India imported goods worth 6.5 billions US dollars and exported in tune of 4.9 billions. Trade deficit amounted 1.62 billions USD dollar in FY 2017-18.
Key Points of India France trade balance in 5 years
- Export to France decreased by 6.6% in FY 2017-18
- Import from France increased by 14.3%
- India’s export to France in 5 years is highest in 2016-17 at 5.2 billions USD.
- India’s import from France is highest in 2016-17 at 6.5 billions USD.
- Trade balance is in favor of France in tune of 1.62 billions USD.
- India’s total export was highest in 2013-14 at 314 billion USD in last 5 years.
- India’s import from France is increasing and it has been increased 76% since 2013-14
Also Read, India UK trade data and Analysis in 2018-18
Review and analysis of India France trade balance
Aircraft is leading commodity imported by France in FY 2017-18, it accounted for more than 50% import in said year. Aircraft is followed by nuclear reactors, boilers, electrical machinery and organic chemicals.
Top 25 commodities Imported from France in 2017-18
| Country: France, value in Million $ US | ||||
| S.No. | Commodity | 2016-17 | 2017-18 | %Growth |
| 1 | Aircraft, Spacecraft, And Parts Thereof. | 3,017.42 | 3,297.80 | 9.29 |
| 2 | Nuclear Reactors, Boilers, Machinery And Mechanical Appliances; Parts Thereof. | 461.9 | 572.98 | 24.05 |
| 3 | Electrical Machinery And Equipment And Parts Thereof; Sound Recorders And Reproducers, Television Image And Sound Recorders And Reproducers,And Parts. | 362.2 | 407.69 | 12.56 |
| 4 | Organic Chemicals | 172.1 | 208.4 | 21.1 |
| 5 | Optical, Photographic Cinematographic Measuring, Checking Precision, Medical Or Surgical Inst. And Apparatus Parts And Accessories Thereof; | 176.17 | 207.26 | 17.65 |
| 6 | Plastic And Articles Thereof. | 143.92 | 186.41 | 29.52 |
| 7 | Mineral Fuels, Mineral Oils And Products Of Their Distillation; Bituminous Substances; Mineral Waxes. | 30.41 | 164.4 | 440.62 |
| 8 | Ships, Boats And Floating Structures. | 7.53 | 139 | 1,745.61 |
| 9 | Iron And Steel | 169.88 | 134.11 | -21.05 |
| 10 | Pharmaceutical Products | 144.31 | 122.5 | -15.11 |
| 11 | Articles Of Iron Or Steel | 93.23 | 120.07 | 28.8 |
| 12 | Miscellaneous Chemical Products. | 100.7 | 98.64 | -2.04 |
| 13 | Essential Oils And Resinous; Perfumery, Cosmetic Or Toilet Preparations. | 69.79 | 76.78 | 10.01 |
| 14 | Rubber And Articles Thereof. | 78.78 | 73.21 | -7.08 |
| 15 | Vehicles Other Than Railway Or Tramway Rolling Stock, And Parts And Accessories Thereof. | 59.95 | 67.64 | 12.82 |
| 16 | Project Goods; Some Special Uses. | 40.25 | 52.01 | 29.2 |
| 17 | Paper And Paperboard; Articles Of Paper Pulp, Of Paper Or Of Paperboard. | 63.84 | 51.72 | -18.99 |
| 18 | Inorganic Chemicals; Organic Or Inorganic Compounds Of Precious Metals, Of Rare-Earth Metals, Or Radi. Elem. Or Of Isotopes. | 40.34 | 49.18 | 21.93 |
| 19 | Aluminum And Articles Thereof. | 20.31 | 31.93 | 57.2 |
| 20 | Edible Vegetables And Certain Roots And Tubers. | 81.13 | 30.08 | -62.92 |
| 21 | Beverages, Spirits And Vinegar. | 27.83 | 29.44 | 5.78 |
| 22 | Soap, Organic Surface-Active Agents, Washing Preparations, Lubricating Preparations, Artificial Waxes, Prepared Waxes, Polishing Or Scouring Prep. | 19.04 | 26.72 | 40.33 |
| 23 | Railway Or Tramway Locomotives, Rolling-Stock And Parts Thereof; Railway Or Tramway Track Fixtures And Fittings And Parts Thereof; Mechanical | 14.1 | 26.58 | 88.46 |
| 24 | Copper And Articles Thereof. | 16.28 | 25.95 | 59.44 |
| 25 | Glass And Glassware. | 16.55 | 23.45 | 41.71 |
India exports clothing, knitted articles, apparel and nuclear reactors primarily to France. It is followed by mineral oils, mineral fuels and vehicles.
Top 25 commodities exported by India to France in 2017-18
| S.No. | Commodity | 2016-17 | 2017-18 | %Growth |
| 1 | Nuclear Reactors, Boilers, Machinery And Mechanical Appliances; Parts Thereof. | 363.91 | 458.51 | 26 |
| 2 | Articles Of Apparel And Clothing Accessories, Knitted Or Crocheted. | 419.85 | 393.69 | -6.23 |
| 3 | Articles Of Apparel And Clothing Accessories, Not Knitted Or Crocheted. | 357.07 | 369.87 | 3.58 |
| 4 | Mineral Fuels, Mineral Oils And Products Of Their Distillation; Bituminous Substances; Mineral Waxes. | 747.71 | 352.02 | -52.92 |
| 5 | Vehicles Other Than Railway Or Tramway Rolling Stock, And Parts And Accessories Thereof. | 231.95 | 320.96 | 38.37 |
| 6 | Electrical Machinery And Equipment And Parts Thereof; Sound Recorders And Reproducers, Television Image And Sound Recorders And Reproducers,And Parts. | 256.1 | 282.41 | 10.27 |
| 7 | Aircraft, Spacecraft, And Parts Thereof. | 743.5 | 250.03 | -66.37 |
| 8 | Footwear, Gaiters And The Like; Parts Of Such Articles. | 155.93 | 190.61 | 22.24 |
| 9 | Pharmaceutical Products | 141.42 | 182.33 | 28.93 |
| 10 | Organic Chemicals | 159.96 | 173.13 | 8.24 |
| 11 | Optical, Photographic Cinematographic Measuring, Checking Precision, Medical Or Surgical Inst. And Apparatus Parts And Accessories Thereof; | 130.5 | 157.89 | 20.99 |
| 12 | Articles Of Leather,Saddlery And Harness;Travel Goods, Handbags And Similar Cont.Articles Of Animal Gut | 142.81 | 150.96 | 5.71 |
| 13 | Articles Of Iron Or Steel | 120.44 | 143.56 | 19.19 |
| 14 | Natural Or Cultured Pearls,Precious Or Semiprecious Stones,Pre.Metals,Clad With Pre.Metal | 108.13 | 139.19 | 28.72 |
| 15 | Other Made Up Textile Articles; Sets; Worn Clothing And Worn Textile Articles; Rags | 114.86 | 132.04 | 14.96 |
| 16 | Miscellaneous Chemical Products. | 85.12 | 117.99 | 38.63 |
| 17 | Animal Or Vegetable Fats And Oils And Their Cleavage Products; Pre. Edible Fats; Animal Or Vegetable Waxes. | 83.05 | 113.71 | 36.92 |
| 18 | Furniture; Bedding, Mattresses, Mattress Supports, Cushions And Similar Stuffed Furnishing; Lamps And Lighting Fittings Not Elsewhere Specified Or Inc | 94.03 | 98.38 | 4.62 |
| 19 | Residues And Waste From The Food Industries; Prepared Animal Fodder. | 70.52 | 91.22 | 29.34 |
| 20 | Rubber And Articles Thereof. | 66.38 | 82.71 | 24.6 |
| 21 | Fish And Crustaceans, Molluscs And Other Aquatic Invertebrates. | 90.67 | 72.07 | -20.51 |
| 22 | Essential Oils And Resinous; Perfumery, Cosmetic Or Toilet Preparations. | 41.56 | 57.42 | 38.16 |
| 23 | Plastic And Articles Thereof. | 57.15 | 53.05 | -7.18 |
| 24 | Glass And Glassware. | 14.66 | 38.5 | 162.64 |
| 25 | Carpets And Other Textile Floor Coverings. | 31.37 | 33.9 | 8.06 |
Source Ministry of Commerce and Industry, India