Australia is emerging as exporter of mineral oils and fuels. India’s total import in 2017-18 with Australia is 13.9 billions US dollar pout of which 9.3 billions USD spent on mineral oils, fuels, bituminous substances and mineral waxes. India’s export in same duration recorded at 4.01 billions USD.
Key Points of India Australia trade balance in 5 years
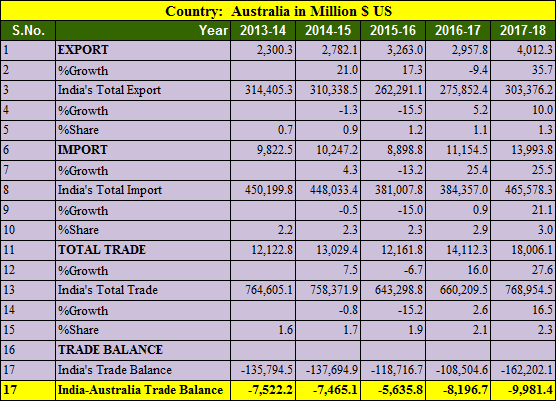
- Export to Australia increased by 35.7% in FY 2017-18
- Import from Australia increased by 25.5%
- India’s export to Australia in 5 years is highest in 2017-18 at 4.01 billions USD.
- India’s import from Australia is highest in 2017-18 at 13.99 billions USD.
- Trade balance is in favor of Australia in tune of 9.98 billions USD.
- India’s total export was highest in 2013-14 at 314 billion USD in last 5 years.
- India’s import from Australia is up and it has been increased by 42.2% since 2013-14
Also Read, India South Africa trade analysis
Top 25 commodity imported from Australia by India in 2017-18
| Country: Australia, Value in Million $ US | ||||
| S.No. | Commodity | 2016-17 | 2017-18 | %Growth |
| 1 | Mineral Fuels, Mineral Oils And Products Of Their Distillation; Bituminous Substances; Mineral Waxes. | 7,025.76 | 9,343.96 | 33 |
| 2 | Edible Vegetables And Certain Roots And Tubers. | 921.74 | 924.14 | 0.26 |
| 3 | Natural Or Cultured Pearls,Precious Or Semiprecious Stones,Pre.Metals,Clad With Pre.Metal, Coin. | 400.03 | 778.2 | 94.54 |
| 4 | Ores, Slag And Ash. | 593.34 | 689.01 | 16.12 |
| 5 | Inorganic Chemicals; Organic Or Inorganic Compounds Of Precious Metals, Of Rare-Earth Metals | 341.53 | 641.92 | 87.96 |
| 6 | Aluminum And Articles Thereof. | 158.12 | 212.68 | 34.51 |
| 7 | Wool, Fine Or Coarse Animal Hair, Horsehair Yarn And Woven Fabric. | 159.92 | 179.46 | 12.22 |
| 8 | Cotton. | 282.86 | 141.82 | -49.86 |
| 9 | Edible Fruit And Nuts; Peel Or Citrus Fruit Or Melons. | 90.94 | 131.69 | 44.81 |
| 10 | Cereals. | 529.67 | 131.46 | -75.18 |
| 11 | Lead And Articles Thereof. | 94.99 | 120.56 | 26.93 |
| 12 | Nickel And Articles Thereof. | 59.59 | 116.58 | 95.63 |
| 13 | Iron And Steel | 66.8 | 113.39 | 69.73 |
| 14 | Tanning Or Dyeing Extracts; Tannin, Dyes, Pigments And Other Coloring Matter; Paints ; Putty And Other Mastic; Inks. | 58.26 | 83.2 | 42.81 |
| 15 | Paper And Paperboard; Articles Of Paper Pulp, Of Paper Or Of Paperboard. | 54.95 | 57.2 | 4.1 |
| 16 | Nuclear Reactors, Boilers, Machinery And Mechanical Appliances; Parts Thereof. | 49.93 | 56.31 | 12.77 |
| 17 | Optical, Photographic Cinematographic Measuring, Checking Precision, Medical Or Surgical Inst. And Apparatus Parts And Accessories Thereof; | 46.17 | 44.4 | -3.83 |
| 18 | Zinc And Articles Thereof. | 22.53 | 31.55 | 40.05 |
| 19 | Electrical Machinery And Equipment And Parts Thereof; Sound Recorders And Reproducers, Television Image And Sound Recorders And Reproducers,And Parts. | 20.75 | 25.57 | 23.25 |
| 20 | Pulp Of Wood Or Of Other Fibrous Cellulose Material; Waste And Scrap Of Paper Or Paperboard. | 11.19 | 18.56 | 65.92 |
| 21 | Pharmaceutical Products | 9.88 | 14.25 | 44.2 |
| 22 | Plastic And Articles Thereof. | 10.09 | 13.71 | 35.8 |
| 23 | Products Of The Milling Industry; Malt; Starches; Insulin; Wheat Gluten. | 13.13 | 12.23 | -6.85 |
| 24 | Rubber And Articles Thereof. | 3.29 | 11.84 | 259.54 |
| 25 | Organic Chemicals | 7.89 | 10.71 | 35.65 |
Top 25 commodities exported to Australia by India in 2017-18
| Country: Australia, Value in Million $ US | ||||
| S.No. | Commodity | 2016-17 | 2017-18 | %Growth |
| 1 | Mineral Fuels, Mineral Oils And Products Of Their Distillation; Bituminous Substances; Mineral Waxes. | 706.2 | 1360.0 | 92.6 |
| 2 | Natural Or Cultured Pearls,Precious Or Semiprecious Stones,Pre.Metals,Clad With Pre.Metal;Coin. | 276.1 | 289.9 | 5.0 |
| 3 | Pharmaceutical Products | 213.8 | 227.0 | 6.2 |
| 4 | Railway Or Tramway Locomotives, Rolling-Stock And Parts Thereof; Railway Or Tramway Track Fixtures And Fittings And Parts Thereof; Mechanical | 103.5 | 206.3 | 99.2 |
| 5 | Nuclear Reactors, Boilers, Machinery And Mechanical Appliances; Parts Thereof. | 127.8 | 157.1 | 23.0 |
| 6 | Electrical Machinery And Equipment And Parts Thereof; Sound Recorders And Reproducers, Television Image And Sound Recorders And Reproducers,And Parts. | 88.9 | 135.9 | 52.8 |
| 7 | Vehicles Other Than Railway Or Tramway Rolling Stock, And Parts And Accessories Thereof. | 105.2 | 134.5 | 27.9 |
| 8 | Articles Of Iron Or Steel | 89.8 | 130.5 | 45.3 |
| 9 | Other Made Up Textile Articles; Sets; Worn Clothing And Worn Textile Articles; Rags | 128.5 | 130.0 | 1.2 |
| 10 | Articles Of Apparel And Clothing Accessories, Not Knitted Or Crocheted. | 99.4 | 109.1 | 9.7 |
| 11 | Articles Of Leather,Saddlery And Harness;Travel Goods, Handbags And Similar Cont.Articles Of Animal Gut | 66.2 | 76.1 | 14.9 |
| 12 | Articles Of Apparel And Clothing Accessories, Knitted Or Crocheted. | 60.4 | 73.3 | 21.5 |
| 13 | Carpets And Other Textile Floor Coverings. | 61.2 | 66.5 | 8.7 |
| 14 | Miscellaneous Chemical Products. | 62.0 | 63.4 | 2.3 |
| 15 | Coffee, Tea, Mate And Spices. | 57.3 | 60.4 | 5.3 |
| 16 | Rubber And Articles Thereof. | 46.2 | 60.2 | 30.2 |
| 17 | Plastic And Articles Thereof. | 55.6 | 58.1 | 4.5 |
| 18 | Cereals. | 36.0 | 45.5 | 26.4 |
| 19 | Furniture; Bedding, Mattresses, Mattress Supports, Cushions And Similar Stuffed Furnishing; Lamps And Lighting Fittings Not Elsewhere Specified Or Inc | 39.9 | 41.3 | 3.6 |
| 20 | Organic Chemicals | 36.7 | 36.5 | -0.6 |
| 21 | Iron And Steel | 28.0 | 33.4 | 19.1 |
| 22 | Essential Oils And Resinous; Perfumery, Cosmetic Or Toilet Preparations. | 25.6 | 29.1 | 13.7 |
| 23 | Optical, Photographic Cinematographic Measuring, Checking Precision, Medical Or Surgical Inst. And Apparatus Parts And Accessories Thereof; | 21.4 | 28.6 | 33.7 |
| 24 | Footwear, Gaiters And The Like; Parts Of Such Articles. | 24.2 | 26.4 | 9.2 |
| 25 | Tools Implements, Cutlery, Spoons And Forks, Of Base Metal; Parts Thereof Of Base Metal. | 21.4 | 26.0 | 21.8 |
Source Ministry of Commerce and Industry, India