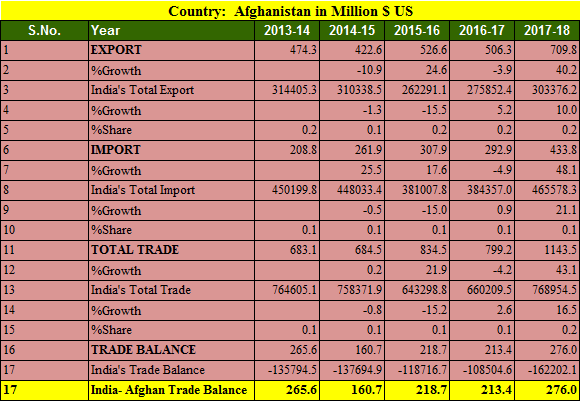
Afghanistan is a disturbed nation due to active role of IS and Taliban. It does have an elected government which is trying to get better hold on existing scenario. India exported goods worth 709 millions and imported 433.8 millions US dollars in FY 2017-18. India has trade surplus with war torn Afghanistan.
Key Points of India Afghanistan trade balance in 5 years
- Export to Afghanistan increased by 40.2% in FY 2017-18
- Import from Afghanistan increased by 48.1%
- India’s export to Afghanistan in 5 years is highest in 2017-18 at 709 millions USD.
- India’s import from Afghanistan is highest in 2017-18 at 433 millions USD.
- Trade balance is in favor of India in tune of 276 millions USD.
- India’s total export was highest in 2013-14 at 314 billion USD in last 5 years.
- India’s import from Afghanistan is up and it has been increased by 107% since 2013-14
Also Read, India Australia trade balance analysis
Top 25 commodity imported from Afghanistan by India in 2017-18
India imported only 18 commodities from Afghanistan in mentioned year
| Country: Afghanistan, Value in Million $ US | ||||
| S.No. | Commodity | 2016-17 | 2017-18 | %Growth |
| 1 | Edible Fruit And Nuts; Peel Or Citrus Fruit Or Melons. | 167.24 | 274.79 | 64.31 |
| 2 | Lac; Gums, Resins And Other Vegetable Saps And Extracts. | 80.05 | 103.33 | 29.08 |
| 3 | Coffee, Tea, Mate And Spices. | 26.06 | 33.66 | 29.15 |
| 4 | Edible Vegetables And Certain Roots And Tubers. | 12.32 | 10.74 | -12.89 |
| 5 | Oil Seeds And Olga. Fruits; Misc. Grains, Seeds And Fruit; Industrial Or Medicinal Plants; Straw And Fodder. | 6.69 | 8.9 | 33.17 |
| 6 | Preparations Of Vegetables, Fruit, Nuts Or Other Parts Of Plants. | 0.1 | 2.01 | 1,935.97 |
| 7 | Salt; Sulfur; Earths And Stone; Plastering Materials, Lime And Cement. | 0.08 | 0.12 | 56.53 |
| 9 | Wool, Fine Or Coarse Animal Hair, Horsehair Yarn And Woven Fabric. | 0.25 | 0.09 | -63.54 |
| 10 | Natural Or Cultured Pearls,Precious Or Semiprecious Stones,Pre.Metals,Clad With Pre.Metal, Coin. | 0.03 | 0.08 | 154.95 |
| 11 | Works Of Art Collectors’ Pieces And Antiques. | 0.02 | ||
| 12 | Printed Books, Newspapers, Pictures And Other Products Of The Printing Industry; Manuscripts, Typescripts And Plans. | 0 | 0.01 | 914.29 |
| 13 | Carpets And Other Textile Floor Coverings. | 0.01 | ||
| 14 | Electrical Machinery And Equipment And Parts Thereof; Sound Recorders And Reproducers, Television Image And Sound Recorders And Reproducers,And Parts. | 0.02 | 0.01 | -25.43 |
| 15 | Products Of The Milling Industry; Malt; Starches; Inulin; Wheat Gluten. | 0 | ||
| 16 | Plastic And Articles Thereof. | 0 | 0 | 200 |
| 17 | Tools Implements, Cutlery, Spoons And Forks, Of Base Metal; Parts Thereof Of Base Metal. | 0 | ||
| 18 | Project Goods; Some Special Uses. | 0 | 0 | 416.67 |
Top 25 commodities exported to Afghanistan by India in 2017-18
| Country: Afghanistan, Value in Million $ US | ||||
| S.No. | Commodity | 2016-17 | 2017-18 | %Growth |
| 1 | Articles Of Apparel And Clothing Accessories, Not Knitted Or Crocheted. | 100.34 | 109.1 | 8.73 |
| 2 | Pharmaceutical Products | 65.31 | 84.82 | 29.89 |
| 3 | Articles Of Iron Or Steel | 1 | 60.72 | 5,962.50 |
| 4 | Tobacco And Manufactured Tobacco Substitutes. | 37.9 | 56.56 | 49.22 |
| 5 | Articles Of Apparel And Clothing Accessories, Knitted Or Crocheted. | 77.93 | 56.19 | -27.89 |
| 6 | Man-Made Filaments. | 34.79 | 47.11 | 35.39 |
| 7 | Man-Made Staple Fibers. | 43.07 | 46.09 | 7.01 |
| 8 | Cereals. | 0.28 | 40.75 | 14,701.71 |
| 9 | Aluminum And Articles Thereof. | 9.4 | 40.56 | 331.42 |
| 10 | Footwear, Gaiters And The Like; Parts Of Such Articles. | 16.65 | 27.9 | 67.49 |
| 11 | Electrical Machinery And Equipment And Parts Thereof; Sound Recorders And Reproducers, Television Image And Sound Recorders And Reproducers,And Parts. | 10.14 | 18.45 | 82.01 |
| 12 | Dairy Produce; Birds’ Eggs; Natural Honey; Edible Prod. Of Animal Origin, Not Elsewhere Spec. Or Included. | 7.34 | 14.58 | 98.57 |
| 13 | Other Made Up Textile Articles; Sets; Worn Clothing And Worn Textile Articles; Rags | 5.19 | 12.32 | 137.34 |
| 14 | Vehicles Other Than Railway Or Tramway Rolling Stock, And Parts And Accessories Thereof. | 6.21 | 9.97 | 60.58 |
| 15 | Nuclear Reactors, Boilers, Machinery And Mechanical Appliances; Parts Thereof. | 9.03 | 8.59 | -4.83 |
| 16 | Organic Chemicals | 2.55 | 7.45 | 191.86 |
| 17 | Rubber And Articles Thereof. | 5.65 | 6.31 | 11.69 |
| 18 | Miscellaneous Edible Preparations. | 0.21 | 6.27 | 2,945.84 |
| 19 | Edible Fruit And Nuts; Peel Or Citrus Fruit Or Melons. | 0.21 | 5.88 | 2,726.60 |
| 20 | Oil Seeds And Olga. Fruits; Misc. Grains, Seeds And Fruit; Industrial Or Medicinal Plants; Straw And Fodder. | 1.78 | 5.49 | 208.41 |
| 21 | Optical, Photographic Cinematographic Measuring, Checking Precision, Medical Or Surgical Inst. And Apparatus Parts And Accessories Thereof; | 6.34 | 4.89 | -22.8 |
| 22 | Essential Oils And Resinous; Perfumery, Cosmetic Or Toilet Preparations. | 3.46 | 4.55 | 31.81 |
| 23 | Natural Or Cultured Pearls,Precious Or Semiprecious Stones,Pre.Metals,Clad With Pre.Metal;Coin. | 4.24 | 4.29 | 1.04 |
| 24 | Coffee, Tea, Mate And Spices. | 3.08 | 4.06 | 31.83 |
| 25 | Preparations Of Vegetables, Fruit, Nuts Or Other Parts Of Plants. | 2.51 | 3.85 | 53.86 |
Source Ministry of Commerce and Industry, India